
Molecular Approaches for Assessing Some Iranian Freshwater Fish Species
Abstract
Monitoring fish biodiversity and its changes over time and their ecological research is one of the important sources of information in their protection. They can be used to find fish biodiversity at different times, such as the capture and maintenance of whole fish, genetic samples, or the use of scales. In this regard, to check the prepared sample, 10-15 scales were prepared from the area of the lid, dorsal fin, and tail stem. Then, they were treated in 5% potassium solution and settled on a slide using a loop microscope equipped with a camera. Among the examined species, Luciobarbusbraczcephalus, Luciobarbuscapito and Capoetasaadispecies could be distinguished from other species with the highest accuracy. In the genetic studies conducted using the cytochrome oxidase subunit 1 gene, the patterns observed in the neighbor joining genealogical tree were consistent with the differences in the genera and species studied. The results of this investigation show that the origin of species can be determined with more than 50% accuracy using genetic data.
Article Information
- Received
- Accepted
- Published
Copyright © 2025 Seyed Elham Mirahmadi, et al.
 This is an open-access article distributed under the terms of the Creative Commons Attribution License, which permits unrestricted use, distribution, and reproduction in any medium, provided the original author and source are credited.
Corresponding author: Mohammad Saeed Heydaranjad, Associate Professor of Department of Zoology, Department of Animal Sciences, Shahrekord, University, Shahrekord —
Competing Interests
The authors have declared that no competing interests exist.
Funding
No specific funding statement was provided by the authors.
Data Availability
No data-availability statement was provided by the authors.
Citation:
Introduction
Fresh water fishes of Iran are very diverse and interesting even without taking into account the fishes of the brackish waters of the Caspian Sea. There are more than 200 species of freshwater fish in Iran, of which carp are the most diverse and are scattered in 19 watersheds (Esmailie et al., 2014). Most of Iran's freshwater fishes belong to three families of carp (Cyprinidae) and two families of dogfish (Cobitidae and Balitoridae). Many of them have the value of economic fishing, sport fishing, aesthetics, biological control and protection (Coad, 2005).
With the emergence of molecular methods during the past few decades, the ability of biologists to recognize and evaluate biodiversity has increased unprecedentedly 1. Today, by using methods such as gene arrays, it is easy to obtain very accurate and fast information about the classification and diversity of organisms, especially fish, without destroying living samples 2. But the use of these methods requires technical facilities and significant costs, which are not easily accessible and cannot be considered as easily accessible and field methods. In addition to these cases, due to the novelty of molecular methods, there are usually no sample banks related to the past, and this makes the use of molecular methods for studies on the biodiversity of fish in the past decades and centuries. In addition, it faces problems and limitations. Therefore, in order to analyze changes in biodiversity over time and adapt these changes to changes in human activity and climatic conditions, we need more preserved sources than other examples in the past. Storing and archiving samples on a scale does not require much facilities, has no significant costs, and can be collected by human labor with minimal training 3.
Various genetic methods are used to classify fish, such as examining the shape and number of chromosomes, examining proteins and enzymes, sequencing, and examining DNA polymorphisms. Among the above-mentioned methods, today, the array method, that is, the preparation of genetic barcodes for mitochondrial genes, has become a universal method for identifying species using a short part of the DNA sequence of a gene or a number of genes. In this approach, the DNA sequence for a part of a gene is prepared and compared for all existing species. This approach is an emerging standard for species identification and the study of biodiversity worldwide using gene sequences. Typically, given that the sequence is specific for each species, the desired sequence acts as a barcode or sequence of the relevant species. In this regard, the mitochondrial gene of cytochrome C oxidase subunit one (COI) is the most suitable candidate gene for array and is used as a universal biological identification system for animals, including fish. In more than 90% of animals to which this method has been applied, species have been successfully identified and separated 4.
Among the freshwater fish of Iran and Mesopotamia, different species of the genus Barbus, the genus Luciobarbus and the genus Capoetaare widely distributed in different watersheds, and their morphological and genetic diversity leads to the description of the four species of Barbus 5 , nine species of Luciobarbus 6 and nineteen species of Capoeta 6 ( Esmaeili et al., 2018) from the Caspian sea, Urmia, Namak and Ker, Zayandeh-Rud, Nain, Kavir, Persian Gulf and Tigris basins. Among the species of Luciobarbus in the Tigris basin, there is a high morphological diversity, which has led to the description of different species, but the morphological diversity is not associated with high genetic differences, and the aforementioned genetic similarities indicate possible interbreeding among the members of this species. The genus has been attributed 7. In this study, we examined using genetic data (COI gene sequences) compared to Barbus and Capoeta species, considering the advantages of using scales to identify species of the genus Luciobarbus in Iran.
Materials and Methods
The samples used in this study were collected using back electroshocker (in Sefidroud and Karun river), throwing net (Shadgan Lagoon) and using Sajuk net (Qanat). After catching the samples on ice, they were transferred to the laboratory and after coding and harvesting the genetic sample (pectoral fin) and scales, they were fixed in 10% formalin. Pectoral fin samples were stored in 95% ethanol alcohol with the same code as fish samples, and after 24 hours, the alcohol was changed. It is important to mention that the identical sample utilized for morphological and genetic research.
DNA extraction
DNA extraction was done using the Qiagen Blood & Tissue kit and using a robot (Eppendorf EpMotion® pipetting-robot) at the Natural History Museum in Berlin. After DNA extraction, DNA quality was checked by electrophoresis on 1% agarose gel (Figure 1).
Figure 1. Electrophoresis of extracted DNA on 1% agarose gel.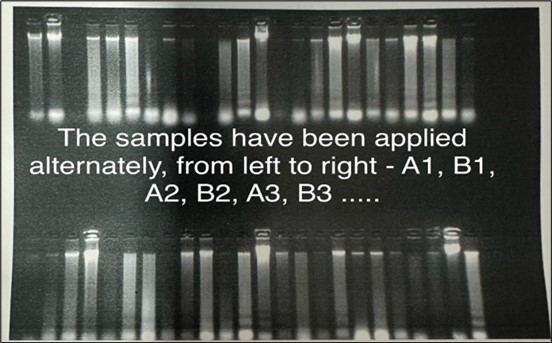
Download figure
COI gene reproduction
After checking the quality of the extracted DNA, amplification of subunit number 1 of the cytochrome oxidase (COI) gene was performed using general primers (Table 1).
Table 1. Primers used for COI gene amplification| Primer | Sequence | Source |
| FishF2_t1 | 5’TGTAAAACGACGGCCAGTCGACTAATCATAAAGATATCGGCAC3’ | Ivanova et al. 2007 |
| FishR2_t1 | 5’CAGGAAA- CAGCTATGACACTTCAGGGTGACCGAAGAATCAGAA3‘ | |
| VF2_t1 | 5’TGTAAAACGACGGCCAGTCAAC- CAACCACAAAGACATTGGCAC3‘ | |
| FR1d_t1 | 5’CAGGAAACAGCTATGACACCTCAGGGTGTCC- GAARAAYCARAA3‘ |
For the amplification of the mentioned gene, polymerase chain reaction with 18 microliters of H2O, 0.2 microliters of 10 μM solution of each primer, 1 microliter of magnesium, 0.5 microliters of dNTPs or free tonucleotides, 2.5 microliters of buffer and polymerase enzyme 2 0.00 microliters along with 2 microliters of DNA that was diluted ten times was used (reaction volume: 25 microliter). For amplification, one cycle of 94 °C for 4 min and thirty cycles of 94 °C for 30 s, 55 °C for 45 s, 72 °C for 60 s and a final extension cycle at 72 °C was used for 8 minutes. After the amplification of cytochrome oxidase subunit one gene, the PCR product was checked by electrophoresis on 1.5% agarose gel (Figure 2, Figure 3). After the amplification of cytochrome oxidase subunit one gene, the PCR product was checked by electrophoresis on 1.5% agarose gel (Figure 2).
Figure 2. Electrophoresis of PCR product on 1.5% agarose gel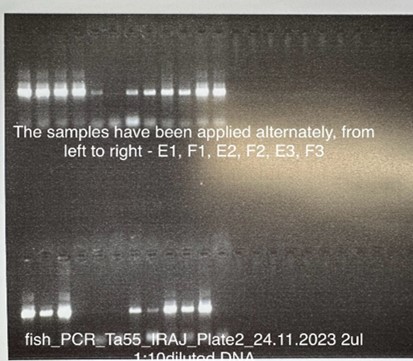
Download figure
Figure 3. Genealogical tree drawn for COI gene sequences with a length of 599 pairs of nucleotides by neighbor joining method using K2P genetic distances and with 500 bootstrap repetitions to calculate the support coefficient of genealogical groups.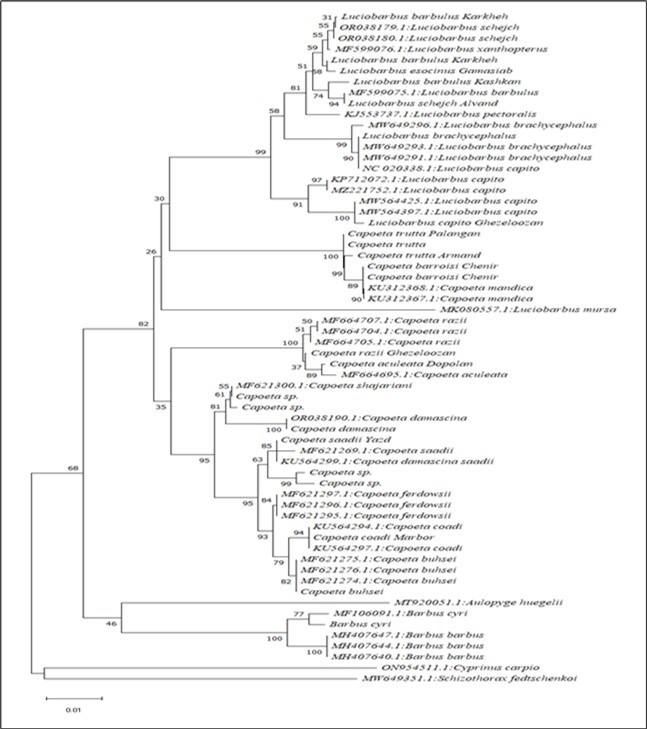
Download figure
Processing and analysis of sequences
The created sequences were edited according to the shape of the chromatogram quality and compared to the published sequences using seqtrace 0.9.0 software. To confirm the species identified by the morphological method, the sequences similar to the sequences obtained by performing a BLAST search in the gene bank were identified and the classification of the investigated fishes was confirmed or corrected with the data published in the gene bank. became. For this purpose, the limit of maximum 2% of barcode sequence difference between the examined samples and gene bank data was considered as the maximum threshold for species definition. In the sense that the lowest similarity value of the sequences with the gene bank sequences is considered to be 98% and if the investigated sequence was more than 98% similar to the sequence or species in the gene bank. The species declared in the gene bank was selected as the investigated fish species, and based on this criterion, classification based on morphology was confirmed or modified. In addition to the BLAST search in the gene bank to check the genealogical relationships of the sequences prepared in this research, after matching and aligning the sequences with the sequences in the gene bank, the genealogical tree of neighborhood joining (NJ) with Using MEGA V 11.0.13 software, 500 bootstrap replicates were drawn for a common sequence of 599 nucleotides in length. In this regard, Cyprinus carpio andSchizothoraxfedtschenkoispecies were used as outgroups to draw the genealogical tree.
Results
Table 2 lists the count of individuals examined for each species along with specific collection sites.
Table 2. Count of individuals examined for each species along with specific collection sites.| No. | Species | Sample counts | Sample site |
| 1 | Capoeta saadii | 10 | Hassan abad |
| 2 | Capoeta buhsei | 9 | Kordan |
| 3 | Capoeta coadi | 18 | Bashar |
| 4 | Capoeta barroisi | 9 | Karoon |
| 5 | Capoeta aculeata | 13 | Dorrodzan |
| 6 | Capoeta damascina | 10 | Sirvan |
| 7 | Capoeta razii | 22 | Sefidrood |
| 8 | Barbus cyri | 14 | Sefidrood |
| 9 | Luciobarbus brachycephalus | 10 | Sefidrood |
| 10 | Luciobarbus schedj | 8 | Shadegan |
| 11 | Luciobarbulus barbulus | 19 | Karoon |
| 12 | Luciobarbus capito | 7 | Sefidrood |
Genealogy
Based on the genealogical tree drawn by the neighbor joining (NJ) method, the species belonging to the genera Luciobarbus and Capoeta were placed in a genealogical group with a support factor of 82% (Figure 3). In the mentioned genealogical group, the subgroups related to Luciobarbus, Capoetatrutta, Capoetadamascina and Capoetaaculitea can be distinguished. Luciobarbus group includes all the species that belong to this genus and their genetic information was prepared in the present study or was taken from the gene bank. C. trutta group includes C. barroisi, C. mandica and C. trutta species, which are included in this group with 100% support factor. The genealogical group of C. damascina includes the species C. damascina, C. shajariani, C. ferdowsi, C. coadi, C. buhsei and C. saadi, which are included in this group with a support factor of 95%. C. aculitea group includes C. aculeata and C. razii species with 100% support (Figure 3). The species B. cyri was also placed next to B. barbus with a support factor of 100%, which confirms the classification based on geographical and morphological information.
Discussion
In Luciobarbus species compared to Capoeta species, there are general appearance differences in the shape that can be used to identify the scales. This can be considered similar to the genealogical differences between the genera Capoeta, Luciobarbusand Barbus, which can be seen in the genealogical studies conducted in this study and other studies 8. Other studies conducted on a limited number of carp species, including several capoeta species, can speculate on similar results. 9. In the genetic studies that have been done so far on the genera and species investigated in this study, the species have also had monophyletic and different clusters 10, 11, 8. The pattern observed in the distribution diagrams of the scales of the species also evokes evolutionary relationships among them to a large extent. For example, the species C. damascina, C. coadi and C. buhsei are placed in an evolutionary group or cluster in genealogical studies, and in this study, a high overlap regarding the shape of the scales of the mentioned species is observed. but the species C. barroisi, which has a separate cluster or clade with the species C. trutta in genetic studies. Regarding the species C. trutta, considering its relative separation from other species of Capoeta, it can be said that the observations of this study are largely comparable with its genealogical relationships with other species of Capoeta. The species C. aculeata and C. razii are also the third group identified in the genetic studies of the genus Capoeta, and in this study, their distribution cluster based on the shape of the scales can be seen to some extent with their genealogical position. In the genetic studies that have been done so far on the Luciobarbus species or based on the genetic data that was prepared in this study about the fishes, it can be seen that the two mentioned species have a very close genetic relationship and The genetic differentiation of their sequences cannot be compared with the genetic differentiation that is usually observed in the genetic barcode or COI gene sequences among species. 11. In the case of these species, various hypotheses including hybridization or new speciation have been mentioned as possible reasons for the small genetic distance 11.
Conclusions
In this study, the main goal was to identify some different species of freshwater fish, among which a number of species belonging to the genera Luciobarbus and Capoeta were selected. The results of this study show that Luciobarbus, Barbus and Capoeta fish species can be separated with relatively high accuracy using COI molecular method.
References
- 1.P O. (2021) Population genomics for wildlife conservation and management. , Molecular Ecology 30(1), 62-68.
- 2.Gutási A, S E Hammer, El-Matbouli M, Saleh M. (2023) Review: recent applications of gene editing in fish species and aquatic medicine. , Animals 13, 1250-10.
- 3.A M Caliendo, D N Gilbert, C, K E Hanson, May L et al. (2013) Better tests, better care: improved diagnostics for infectious diseases.Clinical Infectious Diseases. 57, 139-170.
- 4.Sarri C, Stamatis C, Sarafidou T, Galar I. (2014) A new set of 16S rRNA universal primers for identification of animal species.FoodControl. 43, 35-41.
- 5.Eagder S, Frick R, H R Esmaili. (2019) Annotated checklist of the fishes of the Persian Gulf: Diversity and conservation status.Iranian. , Journal of Ichthyology 6, 12-14.
- 6.Juladeh-Roodbar A, Eagderi S, H R Esmaili. (2020) Fishes of the Dasht-e Kavir basin of Iran: an updated checklist.Iranian. , Journal of Aquatic Biology 3, 263-273.
- 7.Khaefi R, H R Esmailie, Ansari M, Ebrahimi M. (2018) Hashemzadeh Segherloo. , Journal of Genetics 10(2), 229-238.
- 8.B A Levin, Freyhof J, Lajbner Z, Perea S, Abdoli A et al. (2011) Phylogenetic relationships of the algae scraping cyprinid genus Capoeta (Teleostei: Cyprinidae). Molecular phylogenetics and evolution. 62(1), 542-549.
- 9.S N Tabatabei, Eagderi S, Segherloo Hashemzadeh, I, Abdoli A. (2013) Geometric and morphometric analysis of fish scales to identity genera, species and populations case study: the Cyprinid family. , Taxonomy and Biosystematics 5(17), 1-8.
- 10.Hashemzadeh Segherloo I, Abdoli A, Purahmad R. (2015) Phylogenetic and geographic relationships of some species of the genus Capoeta in the Tigris, Persian Gulf, Kerman-Naeen, Namak, Tezdjen, and Caspian basins. , Journal of Genetics 10(2), 229-238.
- 11.Dehkord Abasi, Hashemzadeh Segherloo I, Poria I, M, Khajeh P. (2018) Analysis of phylogenetic status of Luciobarbus esocinus, Luciobarbus xanthopterus, Tor grypus, and Mesopotamichties sharpeyi. , Journal of Fisheries 71(2), 159-166.
- 12.B W Coad, B Y Vilenkin. (2004) . Co-occurrence and zoogeography of the freshwater fishes of Iran.Zoology in the Middle East 31(1), 53-62.