
Abstract
Iron deficiency is a major public health problem worldwide. It affects a significant proportion of the population, and is responsible for around 50% of anemia cases worldwide. Cameroon in general and Lekie Division in particular, is very highlyaffected by this problem. However, early detection of the problem can prevent the fatalities associated to it. The objective of this study was to provide up-to-date, detailed data on the markers of iron status in these populations, so that treatment can be better targeted. A two-month cross-sectional study was conducted in the Lekie Division in collaboration with local health centres in both urban and rural areas. The study sample consisted of 361 participants of all age groups and sexes. A questionnaire was issued to obtain information of the participants socio-demographic status, then 3 to 5ml of blood were collected and a number of markers of the participants iron status were studied. Of all the hematological markers studied, hemoglobin concentration in the study population was below normal in both men and women. Biochemical markers were good for all socio-demographic parameters. The mean values of biochemical and hematological markers in the population of the Lekie Division were good for all socio-demographic parameters, with the exception of hemoglobin concentration, which remains critical, requiring particular attention in this locality, but above all urgent intervention lest the situation aggravates further.
Author Contributions
Copyright © 2025 Guy Noah, et al
 This is an open-access article distributed under the terms of the Creative Commons Attribution License, which permits unrestricted use, distribution, and reproduction in any medium, provided the original author and source are credited.
Competing interests
The authors have declared that no competing interests exist.
Citation:
Introduction
According to the WHO, iron deficiency is the most widespread micronutrient deficiency in the world 1. In many countries, it represents a real public health problem, and is responsible for 50% of anemia cases worldwide 2. Diet is the main cause of iron deficiency in the population and effective prevention requires up-to-date knowledge of the population's iron status 3. This knowledge of the population's iron status is based on the study of a number of markers, both hematological and biochemical; the most common of which are hemoglobin concentration, haematocrit, mean corpuscular volume, mean corpuscular hemoglobin concentration, C-reactive protein, iron, ferritin and serum transferrin 4. The Lekie Division in Cameroon, because of its proximity to the Sanaga River, is a major malaria-endemic area, and is characterised by poor dietary habits 5. The need for up-to-date, detailed data on the iron status of this population is essential for effective planning of control measures.
Methodology
Study framework
The Lekie Division is one of the 58 Divisions in the State of Cameroon and one of the 10 Division in the Centre region. with a surface area of approximately 302,360 km². It is the largest Division in the region and also the most populated after Mfoundi, with approximately 1,487,390 inhabitants grouped into 09 Sub-Divisions which are ; Sa'a, Obala, Okola, Evodoula, Monatele, Elig-mfomo, Ebebda, Batchenga, and Lobo 6. Its climate is equatorial with four seasons, characterised by alternating rainy and dry seasons. Average rainfall is 1,700 m/m per year. The population is predominantly young and very dynamic. The main ethnic groups are the Etons, who make up 80% of the population, and the Manguissas, who account for just 20%. Agriculture is the population's main activity 7. In terms of health and nutrition, malaria and parasitic infections are endemic in this locality and constitute a major public health problem.Tropical diseases such as schistosomiasis are still very much neglected in the area. Although they are permanent in the country, they still receive little attention from public health workers. Malaria, on the other hand, is receiving a great deal of attention, and is the leading cause of morbidity and mortality in children under 5 and pregnant women in particular. It is closely followed by anaemia, mainly because of the poor eating habits suspected in this locality 5.
Type and period of study
This was a descriptive cross-sectional study conducted between January and February 2023.
Sampling
Because of the ethnic non-homogeneity observed in the Lekie Division (80% Etons, 20% Manguissas and others), the sampling was stratified, proportional and random. We had two strata respectively for the two ethnic groups, and these kept thesame proportions observed in the general population in both urban and rural areas. selection of participants was random within each stratum, so that individuals had an equal chance of participating in the study.
Sample size
Taking into account the prevalence of anemia in Cameroon (60%) ; an increase in standard deviation of 1, an odds ratio (OR) of 2, an alpha of 0.05, a power of 0.2, and a correlation coefficient of 0.5, and taking into account a non-response rate of 5%, the final sample size was 156 participants. However, any increase in this sample size also increased the precision of our study and our final sample size was 361 participants.
Criteria for Inclusion
People who are natives and residents (for at least six months) in the locality.
Exclusion criteria
People with chronic or hemoglobin-related illnesses, and people on medication that may affect hemoglobin concentration.
Strengths of the study
Simultaneous analysis of several hematological and biochemical markers for a complete assessment of iron status ;sufficiently large and diversified study population, allowing good representativeness and improved statistical validity ; use of standardized assay techniques validated in the laboratory, guaranteeing reliable results ; adjustment of results according to inflammation by CRP measurement; possibility of comparing different sub-populations with regard to socio-demographic parameters.
Limitations of the study
Limited information on diets that could influence iron status;cross-sectional study not allowing assessment of the evolution or causes of iron deficiency and its consequences;limitation of measured parameters that can provide information on the population’s iron status.
Ethical considerations
This work was carried out with strict respect for the physical, moral and psychological integrity of all participants. Authorisation to carry out this study was obtained from the Centre regional research ethics committee (N°02057/CRERSHC/2022), by issuing an ethical clearance. The administrative and traditional authorities of the Lekie Division were met and informed of the objectives of this study, with the aim of obtaining their consent and soliciting their support for this work.
Collection and analysis of samples
The field team consisted of two state-qualified nurses, local community health workers and researchers from the Food Science and Metabolism Laboratory of the University of Yaounde I, who had been trained before hand. Questionnaires were given to participants in order to collect their socio-demographic data, and they were then subjected to blood sampling by venipuncture of 3 to 5ml of fasting blood between 8am and 12pm. A complete blood count (CBC) was obtained using an automated hematology machine, and serum ferritin, serum iron, serum transferrin and C-reactive protein were assayed using specific assay kits at the Yaoundé University Hospital Centre on each blood sample collected from the participants.
Statistical analysis
The Kolmogorov Smirnov test was used to verify the normality of the data distribution, IBM/SPSS 20.0 for Windows was used for the comparison of means and descriptive statistics, and Microsoft Excel 2016 was used for the graphical representations.
Results
Socio-demographic characteristics of the study population
Gender
The study population was made up of 37% male participants and 63% female participants, as shown in the Figure 1 below.
Figure 1.Breakdown of study population by Gender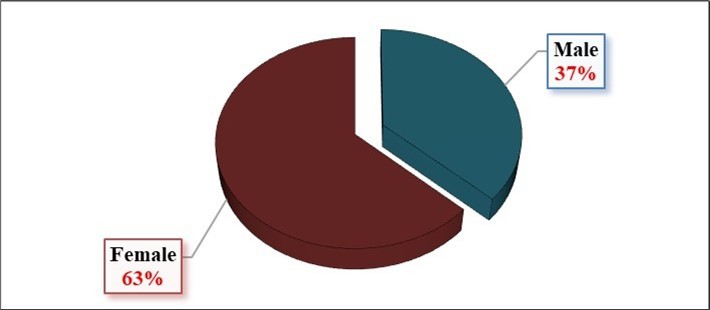
Level of education
The figure below shows that the overall enrolment rate for the study population was 87.8%, with 47.1% at primary level, 38.2% at secondary level and 2.5% at university level Figure 2.
Figure 2.Breakdown of study population by Level of education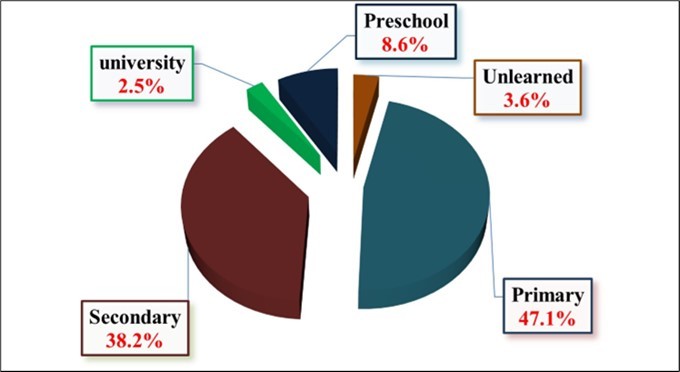
Profession
The figure below shows that the main activity carried out by the study population is agriculture, followed by small-scale jobs in the informal sector. Wage earners represent only 7.8% of the population, while 10.2% of the population is not employed Figure 3.
Figure 3.Breakdown of study population by profession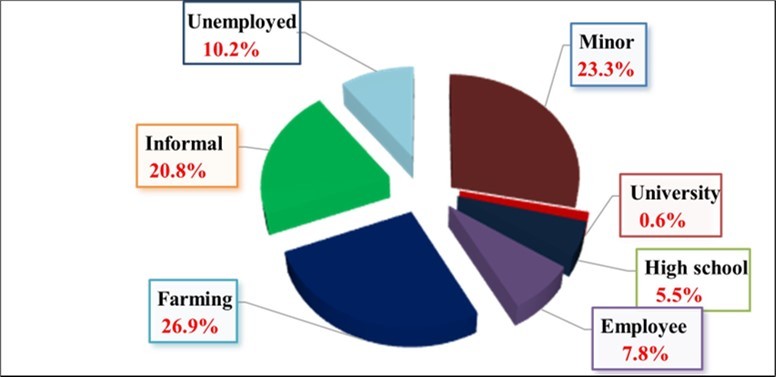
| Features | Hemoglobin (g/dl) VN : ≥11 | Hematocrit ( % ) VN :(37-40) | VGM (fl) VN:(85-95) | ACCH (g/dl) VN:(32-36) | ACCoH (pg) VN :(25-30) | P |
| Ethnic group | NS | |||||
| -Eton | 12.10±1.77 | 40.25±6.20 | 85.38±9.95 | 30.90±2.62 | 26.31±2.87 | |
| -Manguissa | 12.28±1.73 | 40.60±6.51 | 84.36±8.53 | 30.96±2.04 | 26.15±2.72 | |
| Gender | * | |||||
| -Male | 12.54±2.07 | 42.40±6.99 | 86.40±11.8 | 30.59±2.25 | 30.59±2.25 | |
| -Female | 11.91±1.51 | 39.13±5.48 | 84.40±8.00 | 31.11±2.60 | 31.11±2.60 | |
| Age | * | |||||
| - < 5 years | 10.46±1.71 | 33.55±4.79 | 76.02±8.38 | 31.98±2.43 | 24.33±3.03 | |
| - 5-14 years] | 11.02±1.27 | 37.72±3.70 | 82.22±7.58 | 31.01±2.44 | 25.42±2.37 | |
| - 15-49 years] | 12.47±1.70 | 41.09±6.35 | 85.47±9.04 | 31.02±2.41 | 26.48±2.67 | |
| - ≥50 years] | 12.74±1.52 | 42.44±5.86 | 88.28±9.42 | 30.53±2.53 | 26.92±2.81 | |
| Place of residence | NS | |||||
| -Urban | 11.68±1.67 | 36.90±5.25 | 79.88±8.47 | 33.81±1.46 | 27.00±2.93 | |
| -Rural | 12.35±1.76 | 41.90±6.08 | 87.53±9.17 | 29.60±1.59 | 25.94±2.73 | |
| Profession | * | |||||
| -Unemployed | 12.18±1.73 | 39.28±5.41 | 85.36±7.22 | 31.63±3.02 | 27.17±2.28 | |
| -Minor | 10.88±1.53 | 36.48±4.87 | 79.62±9.10 | 31.41±2.53 | 24.93±2.73 | |
| -High school student | 12.07±1.54 | 38.44±5.11 | 83.60±5.70 | 31.70±2.29 | 26.79±2.33 | |
| -University student | 12.30±0.84 | 39.76±0.03 | 80.85±9.10 | 32.95±1.06 | 26.60±2.12 | |
| -Informal sector | 12.87±1.58 | 43.09±5.86 | 88.57±8.45 | 30.23±2.13 | 26.70±2.80 | |
| -Farming | 12.63±1.63 | 42.43±6.86 | 88.25±10.5 | 30.40±2.53 | 26.74±2.84 | |
| -Employee | 12.89±1.42 | 42.01±4.94 | 85.81±8.96 | 31.22±2.05 | 26.79±2.89 | |
| Level of education | * | |||||
| -Unlearened | 12.10±2.18 | 40.95±5.74 | 87.16±7.43 | 30.70±2.88 | 26.61±2.63 | |
| -Preschool | 10.28±1.76 | 32.82±4.64 | 74.60±7.61 | 31.98±2.47 | 23.91±2.93 | |
| -Primary | 12.09±1.66 | 40.90±5.93 | 86.61±9.44 | 30.42±2.56 | 26.30±2.84 | |
| -Secondary | 12.55±1.59 | 41.11±5.96 | 85.55±9.17 | 31.30±2.29 | 26.74±2.62 | |
| -University | 12.94±1.58 | 42.79±6.79 | 84.21±7.44 | 31.03±1.77 | 26.08±2.29 | |
| Marital status | * | |||||
| -Child | 10.86±1.50 | 36.43±4.87 | 79.60±9.15 | 31.42±2.54 | 24.93±2.74 | |
| -Single | 12.45±1.62 | 40.58±6.29 | 86.02±8.79 | 31.26±2.51 | 26.87±2.68 | |
| -Married | 12.75±1.65 | 42.83±6.44 | 88.64±9.52 | 30.29±2.17 | 26.77±2.79 | |
| -Divorced | 12.74±1.03 | 40.68±5.53 | 84.28±6.34 | 31.37±1.96 | 26.45±1.97 | |
| -Widow(er) | 12.61±1.55 | 41.82±4.64 | 86.69±7.79 | 30.74±2.88 | 26.78±2.67 |
| Features | Serum iron (µg /dl) VN : 12-23 | Ferritin (µg /l) VN : ≥ 20 | Transferrin (mg /dl) VN : 200-400 | CST (%) VN : 16-40 | CFT (µmol /l) VN : 45-72 | P |
| Ethnic group | NS | |||||
| -Eton | 76.08±2.95 | 61.58±3.63 | 360.13±78.9 | 22.54±0.92 | 78.23±19.0 | |
| -Manguissa | 82.55±4.97 | 59.15±4.70 | 338.56±69.8 | 25.32±1.86 | 73.89±15.9 | |
| Gender | NS | |||||
| -Male | 87.63±4.09 | 65.39±5.08 | 349.34±81.6 | 27.12±1.59 | 75.28±19.7 | |
| -Female | 71.84±3.19 | 58.42±3.65 | 358.10±74.6 | 20.94±0.90 | 78.27±17.5 | |
| Age | * | |||||
| < 5 years | 81.56±7.57 | 68.97±8.98 | 338.21±87.2 | 22.89±3.36 | 76.94±19.8 | |
| 5-14 years] | 73.89±4.29 | 68.71±8.88 | 347.32±79.7 | 18.85±1.50 | 79.01±18.1 | |
| 15-49 years] | 84.19±4.71 | 58.93±5.06 | 357.01±84.4 | 21.23±1.37 | 81.22±19.2 | |
| ≥50 years] | 98.32±3.91 | 93.42±5.62 | 321.58±73.8 | 26.70±1.33 | 73.16±16.8 | |
| Place of residence | * | |||||
| -Urban | 57.58±2.88 | 45.27±4.41 | 368.85±70.7 | 18.79±1.00 | 77.77±17.4 | |
| -Rural | 86.81±3.30 | 68.15±3.75 | 348.51±79.4 | 25.23±1.10 | 76.90±18.8 | |
| Profession | * | |||||
| -Unemployed | 73.33±8.69 | 68.81±9.95 | 348.55±75.4 | 22.09±2.35 | 75.30±17.6 | |
| -Minor | 66.38±3.70 | 53.68±5.86 | 364.81±77.0 | 20.13±1.50 | 78.69±19.1 | |
| -High school student | 37.11±2.64 | 17.80±1.82 | 416.63±59.3 | 14.06±2.93 | 89.78±18.3 | |
| -University student | 52.47±1.30 | 19.00±1.00 | 347.35±11.8 | 13.69±7.46 | 79.02±19.0 | |
| -Informal sector | 92.64±5.01 | 75.65±5.31 | 332.00±69.0 | 28.14±1.67 | 72.13±15.8 | |
| -Farmer | 79.46±6.13 | 59.37±6.78 | 360.83±82.7 | 23.21±1.81 | 79.42±19.6 | |
| -Employee | 98.50± 9.73 | 64.64±9.94 | 346.74±76.0 | 26.12±2.79 | 76.44±17.1 | |
| Level of education | NS | |||||
| -Unlearned | 77.28±4.50 | 87.31±20.5 | 340.54±63.3 | 26.84±12.8 | 72.22±19.8 | |
| -Preschool | 66.62±7.99 | 48.13±8.03 | 374.22±1.70 | 23.11±13.1 | 78.01±20.8 | |
| -Primary | 78.99±3.58 | 67.08±4.86 | 349.73±79.1 | 23.02±13.0 | 76.87±18.4 | |
| -Secondary | 77.29±4.17 | 52.87±3.81 | 358.52±77.0 | 22.91±12.9 | 77.98±17.9 | |
| -University | 96.77±4.80 | 76.67±2.40 | 350.31±82.9 | 26.84±12.9 | 74.64±17.8 | |
| Marital status | * | |||||
| -Child | 65.96±3.72 | 53.83±5.92 | 366.01±76.4 | 19.99±1.51 | 78.92±19.0 | |
| -Single | 74.84±5.93 | 48.47±5.27 | 372.59±82.3 | 21.76±1.80 | 81.56±19.6 | |
| -Married | 81.84±4.45 | 65.94±5.34 | 347.17±75.5 | 24.48±1.31 | 75.71±17.4 | |
| -Divorced | 78.45±1.30 | 64.70±1.80 | 334.95±55.4 | 24.38±3.17 | 71.42±12.3 | |
| -Widow(er) | 95.75±7.66 | 83.18±7.89 | 326.00±68.7 | 28.85±2.70 | 71.16±16.4 |
Figure 4.Distribution of CRP concentration in the study population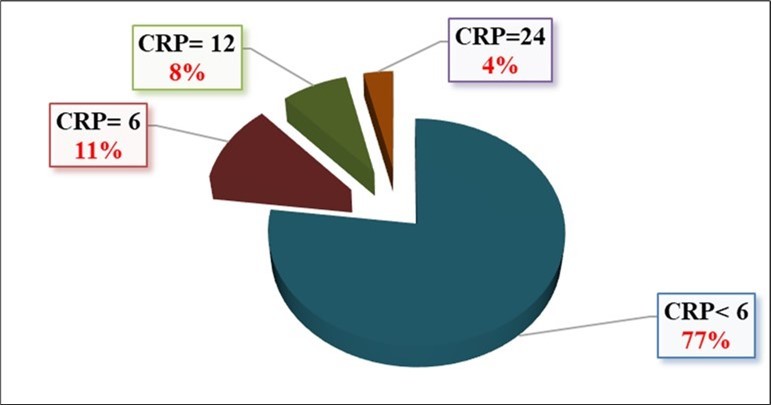
Discussion
When it comes to health-related activities, women and their children are very often susceptible, and therefore more participative, because of their health vulnerability, unlike men. This could therefore justify the high representation of women in this study. The Eton ethnic group is majority in the Lekie Division, accounting for about 80% of the population, compared with 25% for the Manguissa ethnic group. The population is more concentrated in the rural than in urban areas, due to the high level of agricultural activities. The high school enrolment rate can be explained by the presence of school infrastructures in almost every locality in the Lekie Division. However, the primary level was the most represented in this study, because the population were more concentrated in rural areas, which mostly have primary education facilities, therefore only have access to basic education, except for those who have more resources and are therefore able to continue their studies in urban areas, at higher levels. With regards to the marital status of the participants in the study, it is the high level of education which characterises this study population, and their strong adherence to the Catholic religion, which would be the two major assets in these populations' knowledge could be advantages associated with marital stability, which would therefore justify the observed predominance of married people. The Lekie Division is a major agricultural production area, due to its proximity to River Sanaga and the fertility of its soil. Its proximity to the capital city provides a great opportunity for actors in the field, and therefore justifies the fact that agriculture appears to be the main activity pursued by the people of this Division. These results were similar to that obtained in the Democratic Republic of Congo.1
The mean values of hematological parameters in Table 1 showed no significant difference for ethnicity, unlike for gender. The hemoglobin concentration specifically was higher in men (12.54±2.07) than in women (11.91±1.51). This result could be justified by the fact that women are physiologically more prone to blood loss, and therefore to iron loss, than men.8 The lowest hemoglobin concentration was observed in children under 5 years of age (10.46±1.71). Children under 5 are a major target for anemia, not only because of their vulnerability to malaria and other pathologies associated with anaemia, but also because of their very poor diet. There was no significant difference between the various parameters for the place of residence. However, hemoglobin concentration was higher in rural than in urban areas. As mentioned above, this can be explained by the fact that in rural areas there is less pollution, which is a source of mosquitoes, and there is a slightly higher consumption of mineral-rich fruit and vegetables than in urban areas. Occupations showed significant differences for all hematological parameters. In general, the working population (employees, farmers, informal workers) had higher mean hemoglobin and hematocrit values than those unemployed. This could be explained by the fact that income from an activity can promote better access to healthcare and a balanced diet for an individual or group of individuals. For the level of education, the mean values of hematological parameters showed significant differences. The highest mean hemoglobin and hematocrit values were observed in people with higher levels of education. In fact, a higher level of education generally implies a better knowledge of hygiene and dietary recommendations and their benefits, which could justify the results observed. With regard to marital status, the highest mean hemoglobin and hematocrit values were observed in married people, which could be justified by the fact that marriage creates a certain stability and synergy of efforts, which very often generates a better economic return, favouring better access to healthcare and a balanced diet. 10
The mean values of the biochemical parameters in Table 2 showed no significant differences by ethnic group or gender. Concentrations of serum iron and ferritin specifically were higher in men than in women. As mentioned above, this result could be justified by the fact that, from a physiological point of view, women are more prone to blood loss, and therefore to iron loss, than men, as iron is a major mineral making up hemoglobin in the blood. In terms of age group, the lowest serum iron concentration was observed in adolescents aged 5 to 14 (73.89±4.29), while subjects aged 50 and over had the best biochemical profile. This result was different from that of 9. Like children under 5, adolescents aged 5 to 14 are also a major target for anemia, not only because of their vulnerability to malaria and other pathologies associated with anemia, but also because their diet is very often poor, which could therefore justify these results. There were significant differences in the various parameters relating to the environment in which the children lived. However, the biochemical profile was better for subjects living in rural areas than for those living in urban areas. The reason for this seems to be the same as that mentioned above, i.e. in rural areas, pollution, which is a source of mosquitoes, is not very prevalent and therefore limits cases of anemia. In addition, there is a slightly higher consumption of fruit and vegetables rich in minerals, particularly iron, in rural areas than in urban areas. Occupations showed significant differences for all biochemical parameters. Generally, the working population (employees, farmers, informal workers) had higher mean values for biochemical profile parameters than those unemployed. Once again, this could be explained by the fact that income from an activity favours better access to healthcare and to a balanced and more diversified diet for an individual or a group of individuals. There were no significant differences in the mean values of biochemical parameters for level of education. The highest average serum iron concentration was observed in people with higher levels of education. A high level of education is therefore associated with a good biochemical profile. With regards to the marital status of the participants, the highest mean values for biochemical parameters were observed among widows/widowers, followed by married people. Indeed, it is known that marriage creates a certain stability and synergy of effort, which consequently generates better economic performance, favouring better access to healthcare and a balanced diet, which would therefore justify this result. Similarly, widows and widowers usually inherit and manage the benefits of the synergy of effort built up during marriage, and can therefore still have access to better healthcare and nutrition.10
Conclusion
At the end of this study, it is important to note that the mean values of biochemical and haematological markers in the population of the Lekie Division were good for all socio-demographic parameters, with the exception of hemoglobin concentration, which remains critical, requiring particular attention in this locality, but above all urgent intervention is needed to prevent the situation from deteriorating further, especially as the consequences are fatal and sometimes irreversible.
Authors Contributions
Noah Guy : conceptualization, study design, data collection, data analysis and interpretation, drafting of the manuscript, reviewing of the manuscript. ; Fokou Elie : conceptualization, study design, literature review, data interpretation, revision of the manuscript. ; Bebbe Fadimatou : study design, literature review, data interpretation, revision of the manuscript. ; Eposi Haddison : study design, literature review, data interpretation, revision of the manuscript. ; Mbassi Manga Gilbert G : study design, literature review, data collection, revision of the manuscript. ; Kemzeu Raoul : study design, literature review, data collection, revision of the manuscript. ; Nomo Nga Genevieve : study design, literature review, data collection, revision of the manuscript. ; Vicky Ama Moor : study design, data interpretation, revision of the manuscript.
References
- 1.O M S. (2023) anemia reduction: A comprehensive framework for action. Geneva : World Health Organization. Licence :. , CC BY-NC-SA 3, IGO..
- 2.Diouf S, Folquetb M, Mbofungc K, Ndiayed O, Broue K et al. (2015) Prevalence and determinants of anemia in young children in French-speaking Africa. Role of iron deficiency. , Archives of Pediatry Vol 22(11), 1188-1197.
- 3.Atungale Alphonse Muninga, Steve. (2023) Cele Atungale, Bakua Bueso, Pierre Muzita Ngangu, Emery Otak Ngalafele, Guelhen Lutondo Makuba, Simon Mulumba Kasonga, Lysa Camille Lukadi, Jeannot Ilolo Zanga, Olivier Bifalo Mukanima, Joseph wa Kazadi Tshibangu. , International Journal of Social Sciences and Scientific Studies 2465-2476.
- 4.Stein J, Hartmann F, Dignass A U. (2010) Diagnosis and management of iron deficiency anemia in patients with IBD. , Nat Rev Gastroenterol Hepatol 7(11), 599-610.
- 5.A Koppert Georgius J. (1996) Honorine Rikong Adié, Sarah Gwangwa'a, Estelle Sajo Nana, Mirjam Matze, Patrick Pasquet, Alain Froment and Igor de Garine. , Paris, Orstom-l'Harmattan 237-254.