Abstract
Membrane dynamics in the presynaptic region of the neuron is a key process of neuronal signal transduction. Dynamin plays a central part during endocytosis participating in the deformation of membrane structure and constriction. During the study of molecular interaction of presynaptic proteins, we found that dynamin fraction prepared from brain extract contains several lipid components. Fractionation of lipids with thin layer chromatography and mass-analysis showed the presence of phosphatidylcholine, phosphatidylethanolamine, cerebroside, cholesterol and its-derivatives, and triacylglycerol. Since the GTPase activity of bacterially expressed dynamin was activated by the extracted lipid fraction, lipid components that affect the GTPase activity of dynamin was screened and cerebroside, hydroxycholesterols, cholesterol, and triacylglycerol were found to activate the GTPase activity. This result not only suggests the possibility that several neutral lipids participate in the membrane dynamics, but also revealed the possibility that a protein fraction contains lipid components even if its purity was confirmed with SDS-PAGE.
Author Contributions
Academic Editor: Abdelkarim Abousalham, Professor, University Claude Bernard Lyon 1, France.
Checked for plagiarism: Yes
Review by: Single-blind
Copyright © 2018 Satoko Ueno, et al.
 This is an open-access article distributed under the terms of the Creative Commons Attribution License, which permits unrestricted use, distribution, and reproduction in any medium, provided the original author and source are credited.
Competing interests
The authors have declared that no competing interests exist.
Citation:
Introduction
The exocytosis of neurotransmitters and the endocytosis of the membrane of the synaptic vesicles are performed at the presynaptic region of the nervous system. Proteins that participate in these membrane dynamics are hence considered to be enriched in this region. In fact, various proteins in the presynaptic region were found to have specific roles in this process 1.
NAP-22 (also called CAP-23 or BASP1) is a presynaptic protein enriched in the presynaptic membrane and synaptic vesicles, and one of the main proteins of the detergent-resistant low-density fraction (DRM) of neurons 2. In order to elucidate the role of NAP-22 in neurons, its interacting partners were screened using the immunoprecipitation method and several proteins such as synaptojanin1, GAD, capZ, and calcineurin were identified. During this work, the presence of several lipid components in the NAP-22 fraction prepared from rat brain was discovered 3.
In a previous study, we identified another NAP-22-interaction protein, dynamin, in the affinity screening of the crude extract of rat brain 4. Dynamin is a 96kDa protein having GTPase activity principally involved in the scission of newly formed vesicles from plasma membrane. Dynamin is recruited to the site of clathrin-mediated endocytosis by endophilin and amphiphysin, polymerizes at the neck region of the Ω-shaped membrane. The vesicles are then pinched off the membrane through the conformational change of the dynamin using hydrolysis of GTP and interaction to the membrane lipids 5, 6.
Since dynamin is also a membrane binding protein, we attempted to detect lipid components in the dynamin fraction prepared from rat brain and found the presence of some lipid molecules. Since this lipid fraction enhanced the GTPase activity of dynamin, we analyzed the lipid species with thin layer chromatography (TLC) and liquid chromatography and mass spectrometry (LC-MS) analysis and found that cholesterol, hydroxycholesterols, cerebroside and triacylglycerol activate the GTPase activity of dynamin.
Materials and Methods
All experimental protocols were performed in accordance with the guidelines for animal research of the Physiological Society of Japan and this study was approved by the Institutional Animal Care and Use Committee (Permission number; 26-10-02) and carried out according to the Kobe-University Animal Experimentation Regulations. All biochemical procedures were performed at 0~4℃ unless otherwise described.
Chemicals
Commercially available lipids and lipid-derivatives were obtained as follows. 7α-hydroxycholesterol (7OHC) was obtained from abcam plc. 27-hydroxycholesterol (27OHC) was from Avanti Polar Lipids, Inc. 24(S)-hydroxycholesterol (24OHC) was obtained from Focus Biomolecules. Triacylglycerol (TG)(1,3-palmitin-2-myristin) was from Larodan AB (Sweden). Cholesterol (CHL) (chicken egg), phosphatidylcholine (PC) (porcine brain) and phosphatidylethanolamine (PE) (porcine brain) were obtained from Nacalai Tesc (Japan). These lipids were dissolved in chloroform/methanol (2:1) solution and dried under the stream of N2 gas and suspended with sonication in the buffer in case of the GTPase activity 4.
Preparation of Brain Extract and Brain Protein Purification
Dynamin of brain (B-dynamin) was purified from rat brain using affinity chromatography of amphiphysin II-SH3 domain as described 7 with slight modifications 4. In brief, whole brain obtained from 4~6 week-old Wistar rat was homogenized in 20 mM Tris-HCl, 1 mM CaCl2, 2 mM DTT, 23μM leupeptin, 1 mM phenylmethysulfonyl fluoride (PMSF), pH 7.7, and centrifuged at 20, 000 xg for 30min. The pellet fraction was recovered and washed twice with a buffer containing 20 mM Tris-HCl, 0.1 mM CaCl2, 2 mM DTT, 25μM leupeptin, 1 mM PMSF, pH 7.7. The pellet fraction was then homogenized in a buffer containing 20 mM Tris-HCl, 2 mM EDTA, 2 mM EGTA, 250 mM NaCl, 2 mM DTT, 12μM leupeptin, 1 mM PMSF, pH 7.7, stirred for 30 min and centrifuged at 20,000 xg for 30min. The supernatant fraction was recovered and fractionated with 35% saturated ammonium sulfate. After centrifugation at 20,000 xg for 30min, the pellet fraction was suspended in a buffer containing 20 mM Hepes-KOH, 1 mM EDTA, 200 mM NaCl, 0.1 % Tween 80, 1 mM DTT, pH 7.3, and dialyzed. After centrifugation at 100,000 xg for 30min, the supernatant was applied to a column of GST-Accept gel (Nacalai Tesc, Japan) containing GST-amphiphysin II-SH3 domain. After washing with 20 mM HEPES-KOH, 200 mM NaCl, 1 mM DTT, pH 7.3, dynamin was eluted with 20 mM PIPES-KOH, 1.2 M NaCl, 1 mM DTT, pH 6.5, and stored at −75℃ after dialysis to 5mM Hepes, 0.1mM EGTA, 0.1mM EDTA, 0.1mM DTT, pH 7.4.
Lipid Analysis
Purified B-dynamin fraction through amphiphysin II SH3-domain was lyophilized after dialysis to 20 mM ammonium acetate solution. Lipids were then extracted twice with chloroform/methanol (2:1) solution and dried through vacuum evaporation. After TLC development using chloroform: methanol: H2O (65:35:4 or 65:15:4) (v: v: v), lipid containing silica gel was scraped and lipids were extracted as above. Some of these lipids and whole lipid extract were further analyzed with LC (Agilent 1100 series using Acclaim 120 (ThermoFisher Scientific C18 column)) and Q Exactive MS (ThermoFisher Scientific). The system was used as LC-MS for identification of cholesterol and hydroxycholesterols or as LC-MS/MS for lipid identification for other lipids. LC-MS/MS data were analyzed by LipidSerach® (Mitsui Knowledge Industry, Japan).
Statistical Analysis
Data are presented as mean±SD (n=4). Student’s t-test was used for statistical comparisons and are presented. P<0.05 was considered statistically significant (*), **P<0.01.
Others
Bacterial expression and purification of dynamin (E-dynamin) was done as described 4. GTPase activity of dynamin was measured in a buffer (10 mM Tris-HCl, 10 mM NaCl, 2 mM MgCl2, 0.05% Tween 80, pH 7.4) containing 0.3 mM GTP at 37℃ for 10~30min 7. The reaction was stopped with the addition of EDTA (final 20 mM) and liberated Pi was assayed using malachite green method 4. Biochemical analysis such as protein determination and SDS-PAGE was performed as described previously 8.
Results
1. Identification of Lipids in the B-Dynamin Fraction with TLC and LC-MS/MS.
In a previous study, we found that NAP-22 fraction, prepared from the detergent-resistant low-density fraction of rat brain, contains several lipid components including gangliosides and the interaction of NAP-22 and calcineurin was regulated by these lipids 3. NAP-22 was also shown to bind and regulate the GTPase activity of dynamin 4. Since the GTPase activity of dynamin was known to be regulated with several acidic membrane lipids such as phosphatidylserine and phosphatidylinositol, the presence of lipid components in a purified dynamin fraction prepared from brain was studied. Figure 1A shows the elution pattern of B-dynamin from the affinity column of amphiphysin II SH3-domain. The obtained dynamin fraction showed fairly high purity as described 7. Extraction of lipid components using chloroform/methanol was attempted and the TLC analysis of the fraction showed the presence of several lipid components (Figure 1B, lane 1). Six lipid bands were observed (band 1~6 from bottom to top) and their mobility was compared with standard lipids. Band 1 and band 2 showed similar mobility to PC and PE, respectively. Band 3 and 4 were similar to cerebroside (cerebroside separates into two bands usually). Although the mobility of band 5 did not correspond to applied standard lipids, the mobility of band 6 (top) was similar to CHL. After TLC development, lipid containing silica gel was scraped and lipids were extracted as above. These lipid fractions were further analyzed with LC-MS/MS and obtained data were processed by LipidSerach®. The presence of PC in band 1, PE in band 2, and cerebroside in band 3/4 was confirmed (Table 1). Table 1 also showed the presence of TG in band 6.
Table 1. Top ten lipid species identified by LipidSerach® by processing the data from LC-MS/MS of TLC bands in Fig.1B, lane 1. CerG1 means a globoside with one sugar as the side chain of ceramide, i.e. cerebroside.| Band | 1 | 2 | 3 | 4 | 5 | 6 | ||||||
|---|---|---|---|---|---|---|---|---|---|---|---|---|
| order | Class | Area | Class | Area | Class | Area | Class | Area | Class | Area | Class | Area |
| 1 | PC | 1.05E+11 | PE | 8.78E+09 | CerG1 | 7.62E+09 | CerG1 | 2.69E+10 | PC | 2.23E+09 | TG | 1.80E+09 |
| 2 | PC | 9.49E+10 | PE | 8.78E+09 | CerG1 | 3.17E+09 | PC | 3.47E+09 | TG | 2.04E+09 | TG | 1.80E+09 |
| 3 | PC | 6.10E+10 | PE | 8.30E+09 | CerG1 | 2.69E+09 | TG | 2.12E+09 | TG | 1.90E+09 | Cer | 1.72E+09 |
| 4 | PC | 2.50E+10 | PE | 6.51E+09 | PC | 2.66E+09 | TG | 1.79E+09 | PC | 1.79E+09 | TG | 1.71E+09 |
| 5 | PC | 1.84E+10 | PE | 6.01E+09 | CerG1 | 1.92E+09 | TG | 1.79E+09 | TG | 1.64E+09 | TG | 1.45E+09 |
| 6 | PC | 1.44E+10 | PE | 5.75E+09 | TG | 1.88E+09 | TG | 1.56E+09 | TG | 1.55E;09 | TG | 1.23E+09 |
| 7 | PC | 1.29E+10 | PE | 5.49E+09 | TG | 1.61E+09 | TG | 1.42E+09 | PC | 1.43E+09 | TG | 1.17E+09 |
| 8 | PC | 1.03E+10 | PE | 4.72E+09 | TG | 1.44E+09 | TG | 1.37E+09 | TG | 1.40E+09 | TG | 1.16E+09 |
| 9 | PS | 9.83E+09 | PC | 4.53E+09 | TG | 1.36E+09 | PC | 1.37E+09 | TG | 1.19E+09 | TG | 1.13E+09 |
| 10 | PC | 7.77E+09 | PC | 4.39E+09 | PC | 1.35E+09 | CerG1 | 1.11E+09 | TG | 1.15E;09 | TG | 1.07E+09 |
The developing buffer of TLC was changed slightly, for the reduction of methanol content was found to reduce the mobility of lipids and hence was useful to separate high hydrophobic lipids. Under this condition, the band 6 in Figure 1B separated into two band (band 6 and band 7 in Figure 1C) and the mobility of band 7 was the same to that of TG. Since the mobility of band 6 in Figure 1C was identical with that of CHL (Figure 1C, lane 2), its enrichment in band 6 of Figure 1B (lane 1) was confirmed after calculation of the amount of CHL in each band (Figure 1D). Under this condition, band 5 split into two bands (5a and 5b) and their mobility was near that of standard OHCs (Figure 1C). Since the standard annotation list of LipidSerach® did not contain CHL and hydroxycholesterols (OHCs), these lipids were not detected in Table 1.
Figure 1.Lipid components in B-dynamin fraction. A. Preparation of B-dynamin through amphiphysin II-SH3 affinity column. Ca2+-dependent membrane binding protein fraction was fractionated with 35% saturated ammonium sulfate precipitation (lane 1) and applied to an amphiphysin II-SH3 affinity column. The flow-through (lane 2), wash (lane 3~5), and bound fractions eluted with high NaCl buffer, pH 6.5 (lane 6~10) were analyzed with SDS-PAGE. Molecular mass markers were applied in lane M. The dynamin band was shown with an arrowhead. Lipid extraction was attempted from dynamin fractions (lane 6-10). B. TLC analysis of the lipid extract (1) and standard lipids (2; CHL, 3; cerebroside, 4; phosphatidylserine, 5; phosphatidylinositol, 6; phosphatidylethanolamine, 7; phosphatidylcholine, 8; sphingomyelin, 9; ganglioside mixture), were developed with chloroform: methanol: water (65: 35: 4) (v: v: v). C. TLC pattern developed with chloroform: methanol: water (65:15: 4) (v: v: v). In lane 1, band 5 and band 6 of Figure. 1B were applied. Standard lipids were CHL (2), TG (3), 24OHC (4), 27OHC (5), and 7OHC (6). Band 5 in Figure. 1B was separated into two bands (5a, 5b) and new band was observed over band 6 on the front line (band 7). Upper half of the TLC plate was shown. D. Relative quantification of CHL with LC-MS. The amount of CHL (m/z = 369.35) detected with the LC-MS analysis of the six bands in B (lane 1) was shown.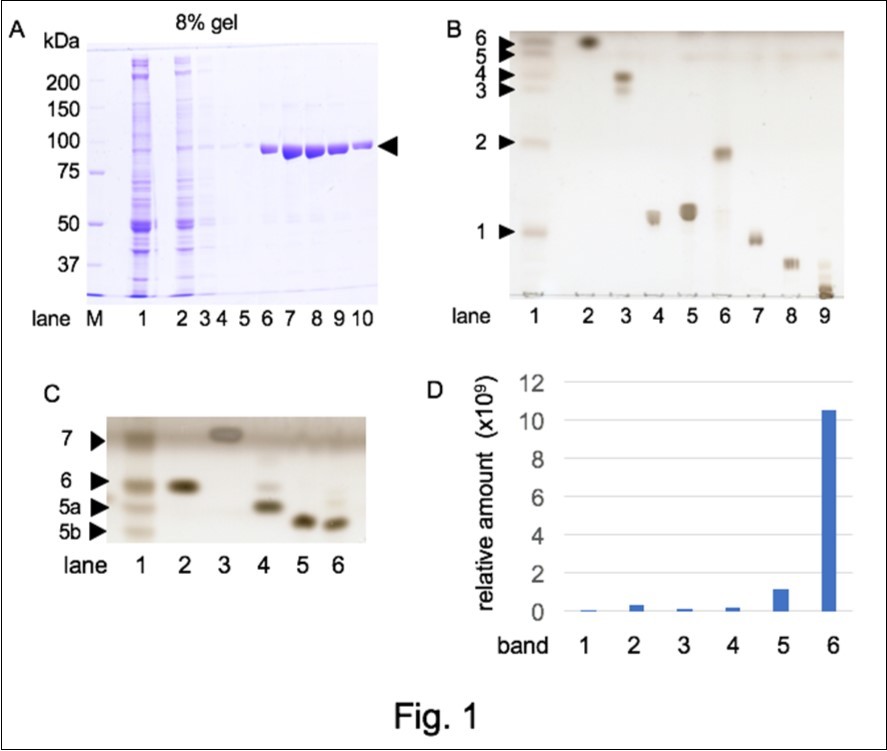
2. Identification of OHCs with LC-MS
In order to confirm the presence of OHCs in the lipid fraction, LC-MS analysis was attempted using commercially available three OHCs (A), the lipid fraction (B), and a mixture of the lipid fraction and OHCs (C) (Figure 2). The molecular mass of OHCs is 402.65. In MS analysis, OHCs were detected as m/z = 367.3371 (after the deletion of two H2O and addition of one H+) or m/z = 385.3465 (after the deletion of one H2O and addition of one H+). The elution pattern of these regions was shown (upper lane, m/z = 367.3338-367.3374; lower lane, m/z= 385.3443-385.3481). In Figure 2A, peaks of 7OHC (a), 27OHC (b), and 24OHC (c) were shown with arrows. In Figure 2B, five peaks were detected in the lipid fraction (#1~#5). Since the lipid amount of these peaks were low compared to that of Figure 2A (NL value of Figure 2A; 8.04 x 10⁸ and 9.56 x 10⁷, Figure 2B; 1.54 x 10⁶ and 2.67 x 10⁶), the peaks of OHCs of the lipid fraction were not evident in the mixture (Figure 2C). Figure 3 shows the mass-spectrum at the retention time of each peak. Peaks of #1, #3, and #4 were weak and their retention time and mass-spectrum did not coincide with that of three standard OHCs. On the other hand, the signal of #2 peak was strong and the mass-spectrum and the retention time were coincided with that of 7OHC. Another strong peak, #5, showed similar mass-pattern to 27OHC, but the retention time was different from that of 27OHC. In summary, the presence of 7OHC in the dynamin lipid fraction was confirmed and the presence of other hydroxycholesterol species different from 24OHC and 27OHC was suggested.
Figure 2.Results of LC-MS analysis with three OHCs and B-dynamin derived lipids. The mass spectrum of 3 types OHC as standard lipids (A), extracted lipids (B), and the mixture of A and B (C) was shown. Signal peaks between m/z 367.3338 and 376.3374 (upper) and between m/z 385.3443 and 385.3481 (lower) were shown. In A, peaks of 7OHC (a), 27OHC (b), and 24OHC (c) were shown with arrows. In B, lipid fraction of B-dynamin showed five peaks (#1~#5) in these m/z ranges. C. A mixture of A and B. NL means the value of the highest peak, for other peaks were NormaLized to this value.
Figure 3.Mass-spectrum of three OHCs (A; 7OHC, B; 24OHC, C; 27OHC) and peaks #1~#5(D~H) of Figure 2. The y-axis shows the relative abundance of each peak normalized to the highest peak. Arrows indicate the peaks of m/z= 367.33 and m/z = 385.33 (those of OHCs). Since the mass-spectrum of #2 (E) and retention time (RT) of two peaks were very similar to those of A, the #2 peak was assigned as 7OHC. Although the mass pattern of another big peak #5 (H) was very similar to that of B (27OHC), this peak was judged other OHC since the retention time of #5 was clearly different from that of 27OHC.
3. Effect of Lipids on Dynamin GTPase
In order to know the biological role of these lipids, the effect on the dynamin GTPase was studied and the lipid fraction was found to activate of the GTPase activity of dynamin (Figure 4A). Since PC and PE were found in band 1 and band 2, their effect on the GTPase was studied and they showed no effect (Figure 4B). The results of TLC and LC-MS analysis suggested that bands in Figure 1B (lane1) were cerebroside (band 3 and 4), OHCs (band 5), CHL and TG (band 6), respectively. The effect of these lipids on the GTPase activity of dynamin was studied. Interestingly, these lipids showed the activation of the GTPase.
Figure 4.The effect of lipids on the GTPase activity of E-dynamin. A. The effect of the lipid fraction. B. The effect of PC and PE (each 50μg/ml). C. Effect of several lipid and lipid-derivatives (50μM each) on the GTPase activity of E-dynamin.
Discussion
In this study, we showed the presence of several lipid species in the dynamin fraction prepared from rat brain. Since no lipid was recovered in the binding fraction of amphiphysin II-SH3 domain after the heat treatment of the dynamin fraction in boiling water for 5 min and centrifugation at 20,000 xg, for 30min, at 4℃ to remove the aggregated protein (data not shown), these lipids were considered to be associated with dynamin. Since the dynamin fraction prepared using a Ca2+-dependent binding to the membrane fraction and through an affinity purification is of fairy high purity (Figure 1A), some of these lipids were considered to have dynamin-binding property. Activation of the GTPase activity of dynamin by CHL, TG, OHCs, and cerebroside confirmed their binding to dynamin.
Identification of lipid species was done using TLC and LC-MS/MS, and the presence of PC, PE, cerebroside, and TG was shown. In order to screen the presence of some OHCs, three OHCs were selected for the internal standard of LC-MS. 24OHC is the major brain CHL metabolites produced exclusively in neurons and eliminates CHL from neurons 9, 10. Formation of lipid droplet-like structures and induction of neuronal cell death through esterification of 24OHC is reported 11. 27OHC is a circulatory breakdown product of CHL that is transported into the brain 12. 7OHC is a possible biomarker of cellular lipid peroxidation 13. In this study, we identified the presence of 7OHC in the dynamin lipid fraction. Although the presence of another hydroxycholesterol was detected, its identity is unknown at present. Activation of the GTPase activity of dynamin by these OHCs showed their direct interaction to dynamin.
Although the molecular components of this lipid fraction have not been fully identified, absence of sphingomyelin and phosphatidylserine in the fraction (Figure 1B) suggests that the lipid fraction does not derived from fragmented cell membranes. Presence of TG and CHL in the fraction suggests that the lipid droplet could be one of the source 14, 15. In adipocytes, dynamin- and protein kinase C dependent cholesterol-induced trafficking of caveolins to lipid droplets has been reported 16. Participation of dynamin II for the lipid metabolism in the neuromuscular junctions on muscle cells was reported 17. Screening of marker proteins of lipid droplet could be a good clue to identify the nature of this lipid fraction 18. Presence of OHCs in the fraction is another interesting point because the importance of CHL metabolism in brain is well recognized 19 and various functions of oxysterols have been elucidated 20.
Recent studies disclosed another role of dynamin in the actin bundling through co-working with cortactin 21, 22. The binding of dynamin I to septin filament and dynamin II to girdin are also reported 23, 24. The presence of multiple dynamin related proteins and their functions are also paid much attention 25. The interaction of dynamin with various lipids could be important in these processes.
The purity of a protein fraction is usually analyzed with SDS-PAGE. In this case, we showed the presence of several lipid components in a “purified” dynamin fraction from rat brain. Multiple regulations of protein functions through post translational modifications are well recognized. Studies on the participation of lipid components in protein functions will be interesting issues.
Abbreviations
DRM - detergent-resistant low-density fraction
TCL - thin layer chromatography
LC-MS - liquid chromatography and mass spectrometry
7OHC - 7α-hydroxycholesterol,
27OHC - 27-hydroxycholesterol,
24OHC - 24(S)-hydroxycholesterol
TG - triacylglycerol
CHL - cholesterol
PC - phosphatidylcholine
PE - phosphatidylethanolamine
PMSF - phenylmethysulfonyl fluoride
OHCs - hydroxycholesterols
References
- 1.B G Wilhelm, Mandad S, Truckenbrodt S, Kroehnert K, Schaefer C. (2014) Composition of isolated synaptic boutons reveals the amounts of vesicle trafficking proteins. , Science 344, 1023-1028.
- 2.Maekawa S, Iino S, Miyata S. (2003) Molecular characterization of detergent-insoluble cholesterol-rich membrane microdomain (raft) of the central nervous system. , Biochim. Biophys. Acta 1610, 261-270.
- 3.Kobayashi Y, Silva da, Kumanogoh R, Miyata H, Sato S et al. (2015) Ganglioside contained in the NAP-22 fraction prepared from the detergent-resistant membrane microdomain of rat brain inhibits the phosphatase activity of calcineurin. , J. Neurosci. Res 93, 1462-1470.
- 4.Ueno S, Miyoshi H, Maruyama Y, Morita M, Maekawa S. (2018) Interaction of dynamin I with NAP-22, a neuronal protein enriched in the presynaptic region. , Neurosci. Lett 657, 59-63.
- 5.Antonny B, Burd C, P De Camilli, Chen E, Daumke O. (2016) Membrane fission by dynamin: what we know and what we need to know. , EMBO J 35, 2270-2284.
- 6.S M Ferguson, P De Camilli. (2012) Dynamin, a membrane-remodeling GTPase. , Nature Rev. Mol. Cell Biol 13, 75-88.
- 7.Quan A, P J Robinson. (2005) Rapid purification of native dynamin I and colorimetric GTPase assay. , Methods Enzymol 404, 556-569.
- 8.Maekawa S, Sato C, Kitajima K, Funatsu N, Kumanogoh H. (1999) Cholesterol dependent localization of NAP-22 on a neuronal membrane microdomain (raft). , J. Biol. Chem 274, 21369-21374.
- 9.Moutinho M, M J Nunes, Rodrigues E. (2016) Cholesterol 24-hydroxylase: Brain cholesterol metabolism and beyond. , Biochim. Biophys. Acta 1861, 1911-1920.
- 10.M Y Sun, Linsenbardt A, Emnett C, L N Eisenman, Izumi Y. (2016) 24 (S)-hydroxycholesterol as a modulator of neuronal signaling and survival. , Neuroscientist 22, 132-144.
- 11.Takabe W, Urano Y, H V Diep-Khanh, Shibuya K, Tanno M. (2016) Esterification of 24S-OHC induces formation of atypical lipid droplet-like structures, leading to neuronal cell death. , J. Lipid Res 57, 2005-2014.
- 12.S W Brooks, A C Dykes, B G Schreurs. (2017) A high-cholesterol diet increases 27-hydroxycholesterol and modifies estrogen receptor expression and neurodegeneration in rabbit hippocampus. , J. Alz. Dis 56, 185-196.
- 13.Saito Y, Noguchi N. (2014) 7-hydroxycholesterol as a possible biomarker of cellular lipid peroxidation: Difference between cellular and plasma lipid peroxidation. , Biochem. Biophys. Res. Commun 446, 741-744.
- 14.Chitraju C, Troetzmuller M, Hartler J, Wolinski H, Thallinger G G. (2012) Lipidomic analysis of lipid droplets from murine hepatocytes reveals distinct signatures for nutritional stress. , J. Lipid Res 53, 2141-2152.
- 16.S Le Lay, Hajduch E, M R Lindsay, X Le Liepvre, Thiele C. (2006) Cholesterol-induced caveolin targeting to lipid droplet in adipocytes: a role for caveolar endocytosis. , Traffic 7, 549-561.
- 17.Tinelli E, J A Pereira, Suter U. (2013) Muscle-specific function of the centronuclear myopathy and Charcot-Marie-Tooth neuropathy-associated dynamin 2 is required for proper lipid metabolism, mitochondria, muscle fibers, neuromuscular junctions and peripheral nerves. , Hum. Mol. Genet 22, 4417-4429.
- 18.Yang L, Ding Y, Chen Y, Zang S, Huo C. (2012) The proteomics of lipid droplet: structure, dynamics, and functions of the organelle conserved from bacteria to humans. , J. Lipid. Res 53, 1245-1253.
- 19.Zhang J, Liu Q. (2015) Cholesterol metabolism and homeostasis in the brain. , Protein Cell 6, 254-264.
- 20.V M Olkkonen, Beaslas O, Nissila E. (2012) Oxysterols and their cellular effectors. , Biomolecules 2, 76-103.
- 21.Yamada H, Abe T, Sato H, Okazaki N, Tago S. (2013) Stabilization of actin bundles by a dynamin1/cortactin complex is necessary for growth cone filopodia. , J. Neurosci 33, 4514-4526.
- 22.Gallo G. (2013) More than one ring to bind them all: recent insights into the structure of the axon. , Dev. Neurobiol 73, 799-805.
- 23.Maimaitiyiming M, Kobayashi Y, Kumanogoh H, Nakamura S, Morita M. (2013) Identification of dynamin as a septin-binding protein. , Neurosci. Lett 534, 322-326.