A Cross Sectional Analysis of Frailty and Markers of Frailty in Young People Living with HIV/AIDS
Abstract
Background
Frailty is an ageing-associated state linked to poor prognostic outcomes. Chronic inflammation due to HIV-infection, AIDS-related infections. and the adverse effects of antiretroviral therapy (ART) all contribute to frailty in people living with HIV/AIDS (PLHA). Frailty has been comprehensively studied in populations comprising predominantly of Caucasian PLHA. However, there remains a dearth of such data in Indian populations, especially in younger PLHA.
Methodology
This cross-sectional study aimed to estimate the prevalence of frailty in PLHA (18 - 50 years) who had been on ART for 24-60 months and identify markers linked to frailty. Frailty was assessed in 152 subjects using the Fried frailty-index. Parameters measured included the mid-upper arm and calf circumferences, pain-severity (using the Brief Pain Inventory), highly-sensitivity C-reactive protein, d-dimer, and interleukin-6.
Results
The prevalence of frailty and pre-frailty were 6.58% and 23.02%, respectively. Reduced grip strength and self-reported exhaustion were associated with frailty (15.79% and 13.16%, respectively). Low calf-circumference and mid-upper arm circumference were not significantly associated with frailty/pre-frailty. The prevalence of pain was 21.7% and both pain severity and pain interference were significantly associated with frailty/pre-frailty. CD-4 counts at the time of assessment showed an inverse association with frailty. Elevated C-reactive protein (CRP of 0.04 associated with 0.49 probability of frailty (95% CI 0.40 – 0.59), CRP of 0.12 associated with 0.63 probability of frailty (95% CI 0.47 – 0.76)). D-dimer levels were not significantly associated with frailty /pre-frailty.
Conclusion
In this first-of-its-kind study on frailty in young PLHA (mean age 37 years) from the Indian sub-continent, the prevalence of frailty and pre-frailty was 6.58% and 23.02%, respectively. Multivariate analysis showed a strong association of frailty with pain severity, CD4 count at time of assessment, hs-CRP levels and duration of ART.
Article Information
- Received
- Accepted
- Published
Academic Editor: Qiang Cheng, Biomedical Informatics Institute, and Computer Science Department.
Checked for plagiarism: Yes
Review by: Single-blind
Copyright © 2024 Nair D R, et al
 This is an open-access article distributed under the terms of the Creative Commons Attribution License, which permits unrestricted use, distribution, and reproduction in any medium, provided the original author and source are credited.
Corresponding author: Sashindran V K, Director Postgraduate Studies and Professor of Medicine K S Hegde Medical Academy, NITTE deemed to be University, Mangaluru India —
Competing Interests
The authors have no conflict of interest to declare.
Funding
The study was funded by an Indian Council of Medical Research short-term scholarship grant (ID 2018-04971).
Data Availability
No data-availability statement was provided by the authors.
Acknowledgements
The study was funded by an Indian Council of Medical Research short-term scholarship grant (ID 2018-04971).
We are grateful to Dr Suman Kumar Pramanik, Professor (Internal Medicine and Haematology, Army Hospital (Research and Referral) Delhi Cantt 110010 for the statistical analysis and Dr Anirudh Anil Kumar for editing the manuscript.
Citation:
Introduction
Frailty is an ageing-related state of increased vulnerability to stressors due to decrease in physio-logical and functional reserves. It is a high-risk state, predictive of adverse health outcomes 1. The inflammatory effects of HIV-infection, HIV-related illnesses and the side-effects of antiretroviral-therapy (ART) have all been suggested as possible reasons for the association between frailty and HIV/AIDS 2. Though the AIDS epidemic has plateaued in India, there are an estimated 2.401 million people living with HIV/AIDS (PLHA) 3. Indian PLHA constitute a third of the world’s HIV-population and with them living longer due to universal availability of effective anti-retroviral therapy (ART), long-term co-morbidities like cardiovascular disease and metabolic syndrome are being increasingly recognised. Frailty in Indian PLHA has, however, not been study in detail.
A widely accepted screening tool for assessing frailty is the Fried criteria. Fried et al. developed a standardised frailty phenotype (FP) by employing data from the Cardiovascular Health Study, in HIV uninfected men and women aged 65 years or older 4. The Multi-centre AIDS Cohort Study (MACS) made a seminal contribution by validating FP for evaluating frailty in PLHA by comparing its results with those obtained using a frailty-related phenotype (FRP) 5, 6.
The prevalence of frailty in PLHA ranges from 5 - 28.6% depending on the type of population studied 7,8. Not only is frailty present in younger PLHA but it has also been observed that PLHA develop frailty earlier than those without HIV infection 9, 10, 11, 12. In a recent systematic review and meta -analysis, Yamada and colleagues found the overall pooled prevalence of frailty and pre frailty to be 10.9% (95% Confidence interval (CI), 8.1 -14.2%) and 47.2% (95% CI, 40.1% - 54.4%) respectively in PLHA aged 50 or older. These figures were comparable to the pooled prevalence of frailty and pre-frailty in HIV negative community-dwelling elders >65 years of age 13. A recent study on HIV-positive and HIV-negative middle-aged individuals showed that when compared to robust individuals, those with frailty had increased risk of both all-cause mortality (mortality rates/1000PYFU 25.7 (95%CI,14.2 - 46.4 vs 2.3 (95% CI, 1.1-4.9) and incident comorbidity (OR2.59, p<-001) irrespective of HIV status 14. Apart from health complications, frailty leads to lower economic productivity and greater requirement for assistance. Clearly, there is a strong case for identifying frailty in younger PLHA and managing it. Younger patients possess better functional reserves compared to elderly patients and interventions maybe effective if frailty is detected early 15.
Pain is a common symptom in PLHA 16. Recent studies suggest that the assessment of pain can be used to predict frailty and that pain may be a phenotype of frailty 17, 18, 19. Similar data reporting high prevalence of pain in PLHA is available from the Indian population as well 15, 20. However, some studies have also questioned the role of pain in predicting frailty 18, 21.
Studies of older PLHA consistently support associations between markers of inflammation and frailty. Such markers include C-reactive protein (CRP), Interleukin-6 (IL-6) and D-dimer. Higher levels of CRP and IL-6 directly affect muscle atrophy, thereby contributing to frailty. D-dimer is a product of fibrin formation as well as degradation, and is a marker of activation of the coagulation-fibrinolytic systems. A report that frail older adults stand an increased risk of developing venous thromboembolism potentially links increased blood coagulation and fibrinolytic activity in frail patients 11, 22, 23, 24, 25, 26, 27, 28, 29, 30.
Several studies report higher levels of inflammatory markers such IL6, CRP and markers of thrombosis like D-dimer in PLHA exhibiting FP compared to their non-frail counterparts, despite good ART regimens11, 31, 32, 33. Frailty has an inverse association with duration of ART. Rees et al. reported a high prevalence of frailty in HIV patients who were on ART <5 years. The prevalence of frailty halved in in those on ART for 5-10 years. And beyond 10 years of ART, most PLHA were non-frail 15. Önen et al.,in the SUN-Study observed that half of their study participants exhibiting frail and pre-frail phenotypes were under 50 years of age 11. Data evaluating frailty in PLHA are available from other Asian countries and Africa 34, 35. However, to the best of our knowledge, there is no such data from India.
The primary objective of this study was to assess the prevalence of frailty in young PLHA. Secondary objectives were to study the association of pain assessment in predicting frailty PLHA and to assess if levels of CRP, IL-6 and D-dimer were associated with frailty in PLHA.
Methodology
Study population and setting
This cross-sectional study involved 152 HIV-infected patients, and was conducted from August to October 2018 at a stand-alone Integrated Counselling and Testing Centre (ICTC) in a tertiary care teaching hospital in Pune, Maharashtra. Approval for the study was obtained from the Institutional Ethics Committee prior to commencement, of the study. Written informed consent was obtained from all participants. PLHA included in the study were those between 20 to 50 years of age, those taking anti-retroviral therapy (ART) for at least 24 months but not more than 60 months, and those who were ambulant and independent for activities of daily living. Individuals who were taking beta-blockers, steroids or diuretics as evidenced by their medical records were excluded from the study.
Patient assessment
All participants were interviewed and data on anthropometry, socioeconomic status and presence of opportunistic infections was recorded. Current co-morbidities, medications, alcohol or tobacco use were self-reported and confirmed from medical records. HIV data and laboratory values were obtained from medical records.
a. Anthropometry:BMI, mid-upper arm circumference (MUAC) and calf circumference were measured in all patients. MUAC was measured in the non-dominant arm at a point halfway between the lateral aspect of the acromion process of the scapula and the tip of the olecranon process of the ulna. Calf circumference was measured at the level of maximum girth.
b. Socioeconomic status (SES): Data was recorded using the updated Kuppuswamy scale 36.
c. Opportunistic infections: Patients were specifically questioned for history of tuberculosis, cryptococcosis or toxoplasmosis, cytomegalovirus (CMV), Hepatitis B and Hepatitis C co-infections.
d. Baseline CD4 count (i.e., count before starting ART) was obtained from patient records and the most recent CD4 count at time of assessment was also recorded.
Frailty assessment
The Fried criteria was used to assess unintentional weight loss, low physical activity, self-reported exhaustion, grip strength and gait speed. Patients meeting 1-2 criteria were labelled pre-frail and those meeting 3 or more criteria were labelled frail: -
a. Unintentional weight loss: More than 4.5kg or ≥5% loss of previous year’s body weight.
b. Low physical activity: Physical activity and exhaustion were assessed by the question: “Does your health limit vigorous physical activities like running and lifting heavy objects. There were three options for the subject to select from:
Not at all = 1
Yes, limited a little = 2
Yes, limited a lot = 3
Those answering 3 were considered to have low physical activity
c. Exhaustion:
Those scoring 2 or 3 for low physical activity were further asked, “How often did you feel that: a) everything you did was an effort, or b) you could not get going?
Rarely (01 day/week) = 0
Some of the time (1-2 days/week) = 1
Occasionally (3-4 days/week) = 2
Most of the time (5-7 days/week) = 3
Participants answering 2 or 3 to either one of two statements were considered to have exhaustion
d. Weak grip strength: Grip strength was tested in dominant hand using a hand grip dynamometer. An average of three readings was obtained and interpreted according to sex and BMI adjustments. Cutoffs for hand grip strength depend on gender and BMI (Table 1).
Table 1. Grip Strength in patients.| c | Males | Females | ||
| BMI (kg/m2) | Kg | BMI (kg/m2) | Kg | |
| Weak grip strength | ≤24 | ≤29 | ≤23 | ≤17 |
| 24.1- 26.0 | ≤30 | 23.1- 26.0 | ≤17.3 | |
| 26.1- 28.0 | ≤30 | 26.1-29 | ≤18 | |
| >28 | ≤32 | >29.0 | ≤21 | |
e. Gait speed: Time taken to walk 4.6 metres was recorded. An average of two readings was obtained and interpreted according to sex and height adjustments. Cut offs for slow gait speed depend upon height and gender. (Table 2)
Table 2. Gait Speed in patients.| Males | Females | |||
| Slow walking time | Height (cm) | Seconds | Height (cm) | Seconds |
| ≤173 | ≥7 | ≤159 | ≥7 | |
| >173 | ≥6 | >159 | ≥6 | |
Pain assessment
Participants were asked for any history of pain since the time of knowledge of the disease and their responses were recorded using the translated version (Hindi) of the Brief Pain Inventory – Short Form questionnaire (BPI) which is validated for use in PLHA. Pain severity was recorded using the Wong Baker FACES® Pain Rating Scale to ensure maximal standardisation.
Measurement of hsCRP, IL-6 and D-Dimer
a. CRP and IL-6: Fasting blood samples were obtained. Serum was separated within one hour and stored at -20°C till the time of batch assay. Tests were performed using ELISA kits of Diclone, France.
b. D-dimer: Fasting blood samples were obtained and centrifuged within one hour. Tests were done daily within three hours using immune-turbidimetric assay for quantitative determination of D-dimer.
Statistical analysis was done using IBM SPSS version 19 and Python 3.7. 5 and stats models 0.11.0 package 37. Descriptive statistics were utilised to describe the study population including demographics and baseline features. For continuous variables, mean (± standard deviation (SD)) and median (interquartile range) values were calculated. Two-sample, two-tailed t-tests were used to compare between group mean FIs. Confidence intervals were 95% intervals, and a significant p value was defined as < 0.05.
Univariate association between frailty and explanatory variables were done using logistic regression analysis with restricted cubic spline transformation (RCS) for the variables to tackle non-linearity. The results were presented as probability of being frail with 95% CI of the probability for lower value of variable versus upper value of variable. To maintain physiological and clinical relevance and to avoid redundancy in variable transformation (as RCS transformation was already carried out) log transformation was not used. Multivariable analysis was done using clinically relevant variables with frailty as binary outcome using logistic regression analysis.
Observations and Results
Demographic and clinical characteristics of study population
These are summarised in Table 3 above. The mean age of the study population was 37.03 yrs (SD +/- 7.70). Mean baseline CD4 count was 349.84 cells/μL and that at the time of assessment was 543.35 cells/μL. The subjects had been on ART for a mean duration of 41.41 months (SD +/- 13.85). None of the subjects had CMV, hepatitis B or hepatitis C infections. 32/152 had past history of TB with mean time since cure ranging from 5 months to 48 months. Eight patients were on active TB treatment.
Table 3. Demographic and anthropometric characteristics| Frail + Prefrail n = 45 (30.26%) | Non frail n = 107 (69.73%) | Total n = 152 (100%) | |
| Gender | |||
| Male | 20 (44.44%) | 45 (42.05%) | 65 (42.76%) |
| Female | 25 (55.56%) | 62 (57.94%) | 87(57.23%) |
| Age | |||
| <30 | 9 (19.99%) | 23 (21.49%) | 32(21.05%) |
| 30 - 40 | 15 (33.33%) | 42 (39.25%) | 57 (37.49%) |
| 40 - 50 | 21 (46.66%) | 42 (39.25%) | 63 (41.44%) |
| Socioeconomic status* | 3.76 | 3.38 | 3.5 |
| BMI | 20.55 | 21.88 | 21.49 (±3.83) |
| MUAC (Average) | 24.57 | 26.07 | 25.63 (±3.53) |
| ART Duration 2-3 years | 20 (44.44%) | 38 (35.51%) | 58 (38.15%) |
| 3-4 years | 15 (33.33%) | 25 (23.36%) | 40 (26.31%) |
| 4-5 years | 10 (22.23%) | 44 (41.12) | 54 (35.52) |
| Type of ART TLE | 24 (54.33%) | 74(69.15%) | 98 (64.47%) |
| ZLE# | 14 (31.11%) | 30 (28.03%) | 44 (28.94%) |
| Baseline CD4 count | 349.84 (±262.73) | 328.93 (±241.66) | 333.00 (±241.30) |
| Latest CD 4 count | 517.73 (±318.76) | 568.97 (±237.51) | 543.22 (±269.37) |
Prevalence and characteristics of frailty phenotype
The prevalence of frailty and pre-frailty (FP+) was 6.58% and 23.02%, respectively. Ninety-four subjects had a low socioeconomic status (Kuppuswamy scale score>4.5). Of these 33 were FP+ and 61 were FP-. Fifty-eight subjects belonged to higher SES and of these 12 were FP+ and 46 FP-. There was no significant association between SES and frailty (Chi-square: 3.5771, p =0.058).
The age distribution of frail/pre-frail subjects is shown in Table 3. There was no significant correlation between age of the subjects and frailty (Figure 1).
Figure 1. Correlation between age and frailty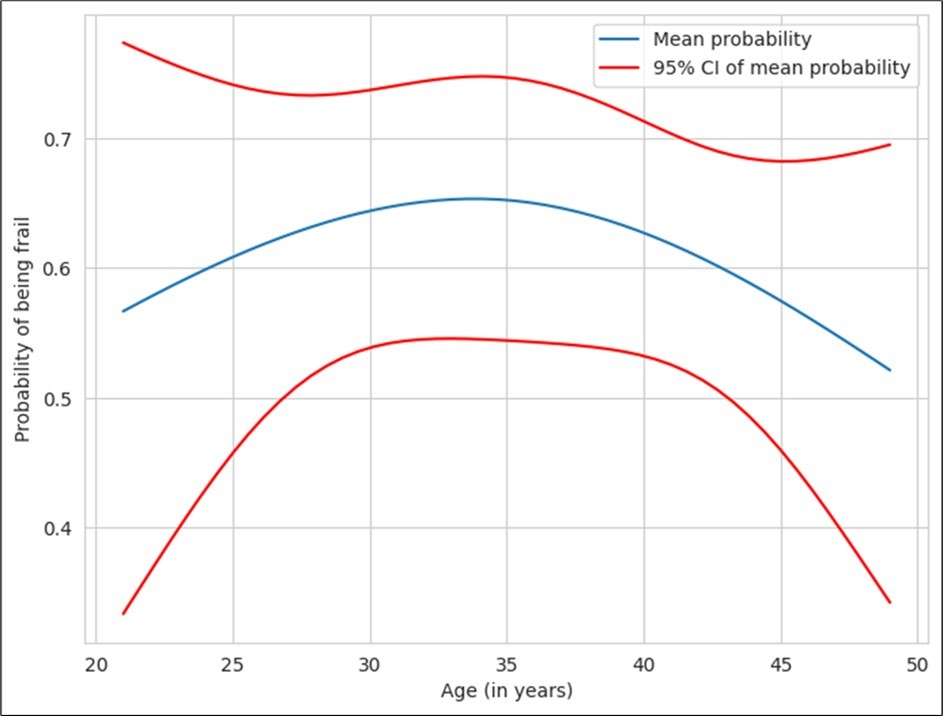
Download figure
Mid-upper arm circumference and calf circumference were taken as surrogate markers of poor nutrition/wasting. Cut off values for calf circumference and mid-arm circumference were 30.5 cm and 21 cm respectively. Values below the cutoffs were considered to be indicative of malnutrition/wasting. MUAC was <21cm observed in 9/45 (20%) frail/pre-frail PLHA, and 6/107 (5.61%) of the non-frail subjects. The calf circumference was < 30.5 cm in 28/45 (62.23%) subjects who were frail or pre-frail and in 37/107 (34.57%) of the non-frail subjects. MUAC and calf circumference showed no significant association with frailty.
The prevalence of pain in the study population was 21.7 %. The calf was the commonest site of pain (67.5%). The other sites of pain were back, forearms and chest (59.45%, 45.94% and 5.40% respectively). Those who complained of pain were more likely to be frail/pre-frail (Odds-ratio: 4.08, p-value for Chi- Square: test of independence = 0.000112). Since the research question was whether BPI could be considered as a surrogate marker for frailty, comparing the measures for concordance (agreement) was considered more appropriate than measuring the quantity of independence by chi square test. Cohen kappa statistics were therefore applied. The value was 0.283, suggesting a poor agreement between the measures. Frail/pre-frail patients also scored higher for ‘pain severity and interference in daily activities’ as compared to their non–frail counterparts. The pain-severity and interference were strongly linked to frailty phenotype, with the relationship being non-linear. As is evident from the graph (Figure 2), beyond a pain-severity score of 3.5, the probability of frailty increases significantly. The risk ratio for frailty is significantly different for pain-severity scores of 3.5 and 4.5, with the mean probability for frailty being 0.25 (95% CI: 0.17-0.34) for a pain severity score of 3.5 and 0.81 (95% CI: 0.65-0.9) for pain severity score of 4.5. The mean probability values for frailty were 0.37 (95% CI: 0.28-0.47) and 0.84 (95% CI: 0.63-0.94) for pain-interference scores of 2.5 and 3.5 respectively with a significant correlation (Figure 3).
Figure 2. Correlation between frailty and pain severity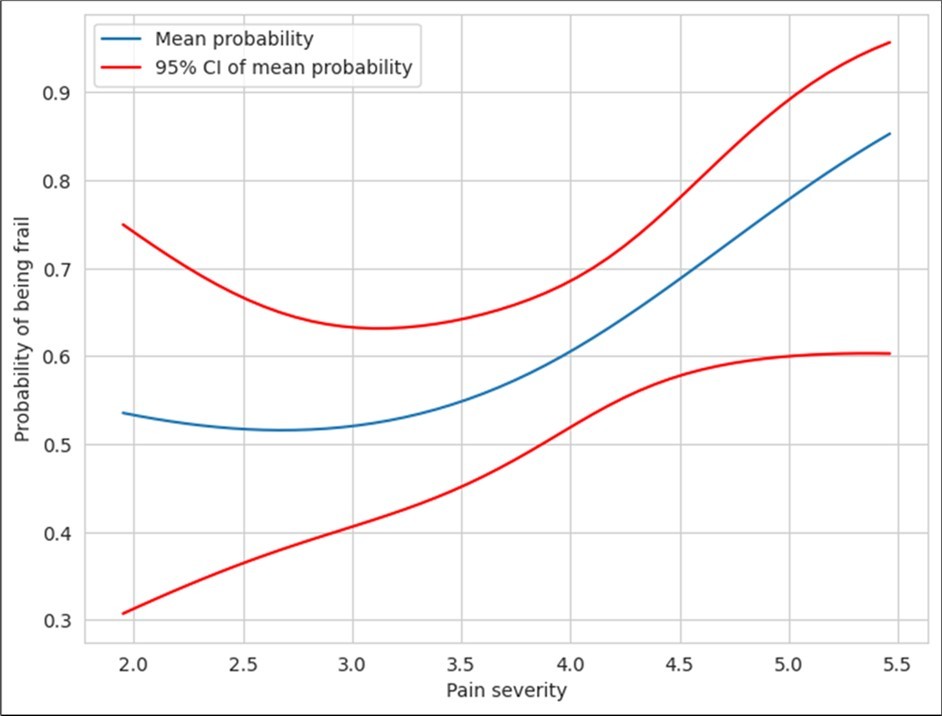
Download figure
Figure 3. Correlation between pain interference and frailty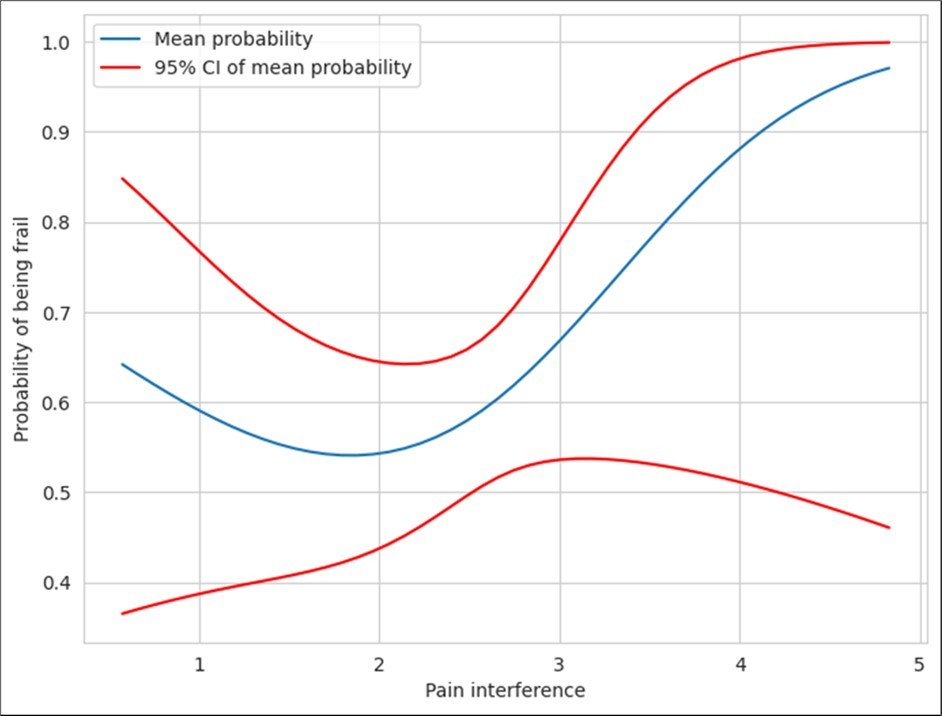
Download figure
Baseline CD4 cell-count, i.e., the CD4 count before starting ART, had no bearing on the occurrence of frailty later. The CD4 count at the time of assessment had an inverse relationship to frailty (Figure 4). Rise in CD4 cell count following initiation of ART was lesser in those with frailty phenotype than in those who were non-frail (p=0.002). CD4 count at the time of assessment was inversely proportional to frailty. Similarly, Δ CD4 (CD4 at assessment/baseline CD4 - 1) was also inversely proportional to frailty.
Figure 4. Correlation between hs-CRP and frailty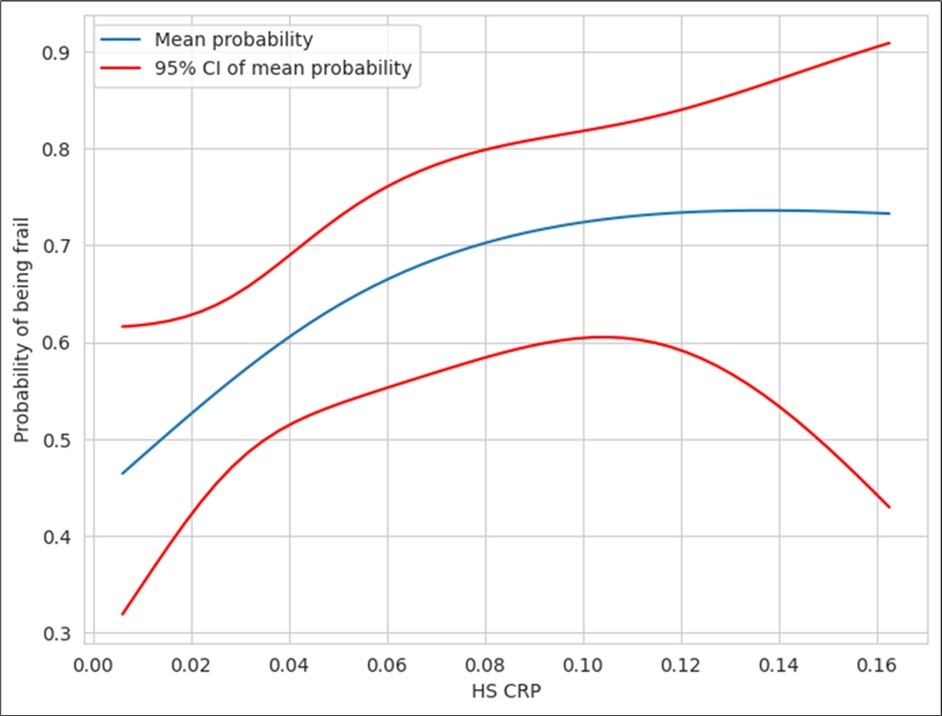
Download figure
There was a significant difference in mean values of hs-CRP between FP+ patients and their FP- counterparts (Table 4). The values were higher in FP+ patients. The plot of probability of frailty against hs-CRP levels is shown in Figure 4 below. There was no significant difference in mean IL–6 values between the two groups (p = 0.4) (Table 5). Similarly, there was no association between D-Dimer levels and frailty.
Table 4. Mean values of inflammatory markers and frailty phenotype| Fried Phenotype | |||
| Inflammatory markers | Frail/Pre-frail (n=45) | Non-frail (n=107) | p value |
| hs-CRP (mg/L) | 0.06 ( ± 0.04) | 0.04 (± 0.03) | 0.017 |
| IL-6 (pg/ml) | 5.52 (± 6.67) | 4.34 (± 8.32) | 0.4 |
| D -dimer (N <0.5µg/ml) | 0.42 (± 0.62) | 0.19 (± 0.49) | 0.015 |
Duration of ART appeared to be significantly linked to frailty in PLHA. Figure 5. Above depicts the proportion of the subjects with frailty plotted against ART duration. The plot reveals a decreasing trend with time. The data was tabulated and used to derive difference in mean of proportion of patients developing frailty. The proportion of frailty at 40 months was 0.73 (95% CI: 0.63-0.82) and proportion of frailty at 60months was 0.34 (95% CI: 0.21-0.51) revealing that there was a significant inverse relationship between frailty and duration of ART. Majority of the subjects were on dual NRTI +NNRTI regimen with tenofovir + lamivudine + efavirenz (98/152) being the commonest regimen. Forty-four subjects were on a zidovudine-based regimen. Ten were on a PI based regimen that also included zidovudine and lamivudine. The regimen showed no association with frailty. The adherence to therapy was optimal (>95%) in 148/152 subjects. Even the 4 with poor adherence (<80%) were non-frail.
Figure 5. Correlation between duration of ART and frailty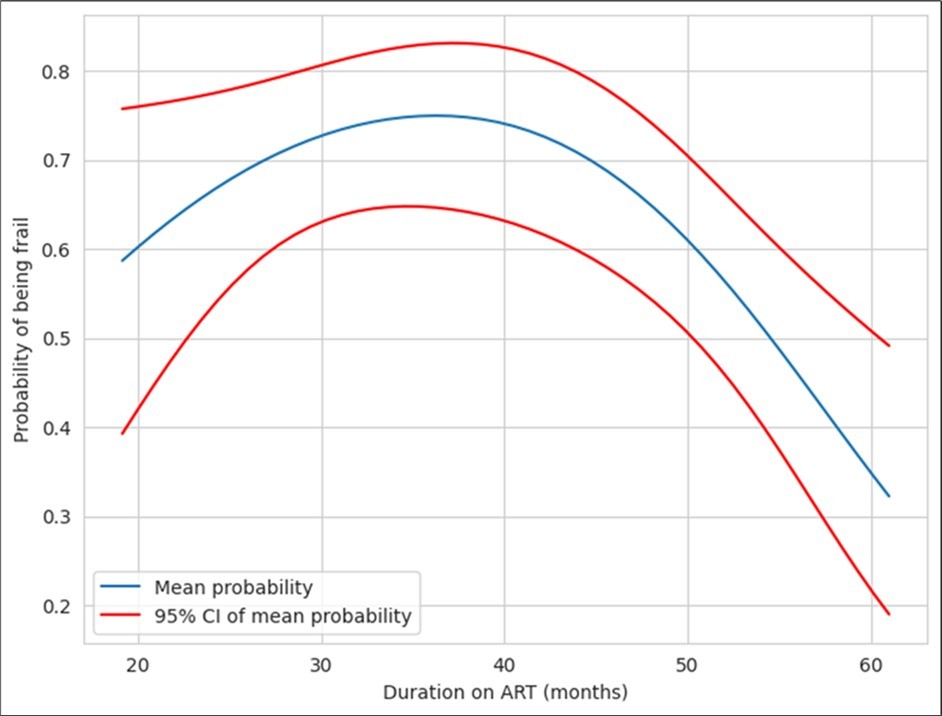
Download figure
Multivariate-analysis for correlation between probability of frailty and parameters l age, sex, duration of ART, pain severity, pain interference, hsCRP, D-dimer and IL-6, was performed. Association between duration of ART, age, pain severity, hsCRP and IL-6 were observed. The odds ratio (adjusted) and 95% CI are shown in Table 5.
Table 5. Association between various factors and frailty on multivariate analysis| Odds ratio (adjusted) | Lower confidencelevel | Upper confidencelevel | |
| Age | 0.871787 | 0.802006 | 9.476389E+01 |
| Duration of ART | 0.971864 | 0.945039 | 9.994509E-01 |
| Pain severity | 17.903095 | 4.421610 | 7.248961E+01 |
| hs-CRP | 7990.599243 | 0.366487 | 1.742208E+08 |
| IL-6 | 1.022994 | 0.958663 | 1.091642E+00 |
Discussion
The prevalence of frailty and pre-frailty was 6.58% and 23.02%, respectively. This is similar to previously published literature7. Our study findings are strictly restricted to PLHA <50 years. Most Western studies include older subjects and their age itself would lead to their being pre-frail or frail. A case in point is the high rates of frailty reported by Jacqueline McMillan among middle-aged and older people living with HIV. The mean age of her subject population (n = 700) was 59.2 with 84% people in the age group of 50 – 64 yrs (range 50 - 92). Most had been on ART for at least 15 years and 93% had undetectable viral loads. The mean CD4 count was 594 cells/µL. Frailty (FI>0.21) was seen in 74.6% of the subjects 38. Our decision to select subjects in the age group of 20 - 50 was influenced by Onen’s observation that half of the pre-frail and frail participants in their study were <50 years of age and due to our interest in studying frailty in your PLHA 6. We also only enrolled subjects who had been on ART for 2 - 5 years. The reason being that most opportunistic infections and immune-reconstitution inflammatory syndromes (IRIS) mostly occur in the first two years of ART and that two years is adequate for immune restitution and viral suppression. Significant association between low CD4 count and frailty and a positive relationship between length of ART and not being frail is well established 7, 8. In Rees’s study the prevalence of frailty halved after 4 years of ART and became negligible by 10 years of ART 15. And more compellingly, our centre was established only 2009 and hence there were not many patients with more than 5 years follow up at our centre.
Unlike studies in Caucasian populations, which have reported low physical activity to be the main marker of frailty, our study identified weak grip strength and self-reported exhaustion to be the commonest frailty markers 19. We offer the following explanation for this: firstly, most of the study participants, being daily wage workers, had no choice but to be physically activity to ensure daily sustenance. They responded that they managed to go about their daily activities as demanded by their work, despite exhaustion. Secondly, younger PLHA were less likely to report low physical activity compared to elderly PLHA. Weak grip strength could either be due to poor nutrition, ethnicity or due to effects of chronic inflammation, more specifically IL-6 induced sarcopenia. Calf and mid-upper arm circumferences had no significant association with frailty.
The prevalence of pain in our study participants at 21.7% is similar to estimates by Nair et al who reported a pain prevalence of 24.5% in out-patients 15, 20. Apart from recurrent headaches, the major sites of pain were the calves and the back. Those who complained of pain were more likely to exhibit frailty/pre-frailty (Odds ratio: 4.08, Chi square: 12.58, p < 0.05). Frail/pre-frail PLHA also scored ‘pain severity and interference in daily activities higher’ compared to their non–frail counterparts. Petit et. al were the first to describe a link between pain and frailty in PLHA albeit in an older population 19. Our observations corroborate this finding but in a younger population subset. We suggest that pain may be a surrogate marker of frailty/ pre-frailty in young PLHA.
No correlation was seen between baseline CD4 count and occurrence of frailty. However, CD4 count at the time of assessment was inversely proportional to frailty as was noted by Rees and Desquilbet 7, 8. Similarly, Δ CD4 (CD4 at assessment/CD4 at baseline - 1) was also inversely proportional to frailty. The average CD-4 count increase following ART in frail/pre-frail patients was significantly lesser in comparison to their non-frail counterparts. Our findings reflect previously published literature in this regard 5, 10.
Levels of hs-CRP were significantly higher among frail/ pre-frail PLHA as compared to non-frail PLHA (HsCRP p = 0.017). These findings are similar to those reported in earlier studies 14, 18, 21. However, unlike most published literature, our study did not detect a significant association between D-dimer and serum IL-6 levels and frailty/pre- frailty phenotypes (p = 0.4) 14, 22, 23, 24, 25, 26, 27.
All the subjects enrolled in our study were on ART for a duration 2 to 5 years for reasons mentioned previously. Our study results favoured our assumption since the prevalence of frailty/pre-frailty decreased as the duration of ART increased. This observation is similar to those made in previous studies 15.
To the best of our knowledge, this is the first study in India on frailty in PLHA and its association with pain and inflammatory markers. Our study is not without limitations: our sample size is relatively small, and we did not have an HIV-uninfected group for comparison. We interpreted weak grip strength and walking time using cut-offs designed primarily for Caucasian populations Ethnicity and genetics are likely to have a role in grip strength, which is part of Fried’s criteria. Once a reference cut-off is established for the Indian population, and Fried’s criteria modified, future studies may reveal different estimates of frailty in Indian population. Lastly, the study’s cross-sectional design prohibits drawing conclusions of causality and directionality of associations found.
Future studies are required to establish age and sex adjusted cut-offs for grip-strength and walking-time in the Indian population for better application of Fried’s criteria in this population. We also believe that the nutritional status of PLHA in India needs to be studied in detail as it may have an association with frailty/pre-frailty. The association of serious co-morbidities and increased mortality with frailty is a matter of concern with PLHA living longer.
Conclusion
In this first-of-its-kind study on frailty in young PLHA (mean age 37 yrs) from the Indian sub-continent, the prevalence of frailty and pre-frailty was 6.58% and 23.02%, respectively. Multivariate analysis showed a strong association of frailty with pain severity, CD4 count at time of assessment, hs-CRP levels and duration of ART. Detecting and addressing frailty in young PLHA might reduce incident co-morbidities and all-cause mortality and reduce healthcare costs.
References
- 1.Ahmed N, Mandel R, Fain M J. (2007) Frailty: an emerging geriatric syndrome.Am. , J 120(9), 748-53.
- 2.Crawford K W, Li X, Xu X. (2013) Lipodystrophy and inflammation predict later grip strength in HIV-infected men: the MACS body composition substudy.AIDS Res Hum Retroviruses.29(8). 1138-45.
- 3.. National AIDS Control Organisation & ICMR-National Institute of Medical Statistics (2022). India HIV Estimates 2021: Fact Sheet. NACO, Ministry of Health and Family Welfare, Government of India .
- 4.Fried L P, Tangen C M, Walston J. (2001) Frailty in older adults: evidence for a phenotype.J Gerontol A Biol Sci Med Sci.56(3). 146-56.
- 5.Desquilbet L, Margolick J B, Fried L P. (2009) Relationship between a frailty-related phenotype and progressive deterioration of the immune system in HIV-infected men.J Acquir Immune Defic Syndr.50(3). 299-306.
- 6.Althoff K N, Jacobson L P, Cranston R D. (2014) Age, comorbidities, and AIDS predict a frailty phenotype in men who have sex with men.J. , Gerontol A Biol Sci Med 69(2), 189-98.
- 7.Levett T J, Creswell F V, Malik M A. (2016) Systematic review of prevalence and predictors of frailty in individuals with human immunodeficiency virus.J. , Amer Geriatrics 64(5), 1006-1014.
- 8.Pigott D A, Muzaale A D, Mehta S H. (2013) Frailty, HIV infection, and mortality in an aging cohort of injection drug users.PLoS One.8.
- 9.Gustafson D R, She Q, Thurn M. (2016) Frailty and constellations of factors in aging HIV-infected and uninfected women - the Women’s Interagency HIV Study.J Frailty Aging.5. 43-48.
- 10.Desquilbet L, Jacobson L P, Fried L P. (2007) HIV-1 infection is associated with an earlier occurrence of a phenotype related to frailty.J. , Gerontol A Biol Sci Med 62(11), 1279-86.
- 11.Önen N F, Patel P, Baker J. (2014) Frailty and Pre-Frailty in a Contemporary Cohort of HIV-Infected. , Adults.J Frailty 3(3), 158-65.
- 13.Yamada Y, Kobayashi T, Condo A. (2022) May). Prevalence of frailty and pre frailty with human immunodeficiency virus aged 50 or older: A systematic review and meta-analysis.Open Forum Infect Dis.9(5), ofac 129. 10-1093.
- 14.Verheij E, Kirk G D, Wit F W. (2020) Frailty is associated with mortality and incident comorbidity among middle-aged human immunodeficiency virus-positive and HIV-negative participants.J Infect Dis. 222(6), 919-928.
- 15.Rees H C, Ianas V, McCracken P. (2013) Measuring frailty in HIV-infected individuals. Identification of frail patients is the first step to amelioration and reversal of frailty.J Vis Exp.e50537. , doi: 10-3791.
- 16.Cox S, Rice A. (2008) . Clinical pain management: chronic pain. London: Hodder and Stoughton HIV and AIDS. In: Wilson PR, Watson PJ, Haythornthwaite JA, Jensen TS, editors 352-61.
- 17.Wade K F, Marshall A, Vanhoutte B. (2017) Does pain predict frailty in older men and women?. , Findings From the English Longitudinal Study of Ageing (ELSA).J Gerontol A Biol Sci Med 72(3), 403-9.
- 18.Nessighaoui H, Lilamand M, Patel K V. (2015) Frailty and pain: Two related conditions.J Frailty Aging. 4(3), 144-8.
- 19.Petit N, Enel P, Ravaux I. (2018) Frail and pre-frail phenotype is associated with pain in older HIV-infected patients.Medicine (Baltimore).97(6).
- 20.Nair S N, Mary T R, Prarthana S. (2009) Prevalence of pain in patients with HIV/AIDS: A cross-sectional survey in a South Indian state. , IndianJ Palliat Care 15(1), 67-70.
- 21.Wade K F, Lee D M, McBeth J. (2016) Chronic widespread pain is associated with worsening frailty. in European men.Age Ageing 45(2), 268-74.
- 22.Cohen H J, Harris T, Pieper C F. (2003) Coagulation and activation of inflammatory pathways in the development of functional decline and mortality in the elderly.Am. , J 114(3), 180-7.
- 23.Walston J, McBurnie M A, Newman A. (2002) Frailty and activation of the inflammation and coagulation systems with and without clinical comorbidities: results from the Cardiovascular Health. , Study.Arch Intern 162(20), 2333-41.
- 24.Ferrucci L, Harris T B, Guralnik J M. (1999) . Serum IL-6 level and the development of disability in older persons.J Am Geriatr Soc 47(6), 639-46.
- 25.Ferrucci L, Penninx B W, Volpato S. (2002) Change in muscle strength explains accelerated decline of physical function in older women with high interleukin-6 serum levels.J Am Geriatr Soc. 50(12), 1947-54.
- 26.Penninx B W, Kritchevsky S B, Newman A B. (2004) Inflammatory markers and incident mobility limitation in the elderly.J Am Geriatr Soc. 52(7), 1105-13.
- 27.Leng S X, Xue Q L, Tian J. (2007) Inflammation and frailty. in older women.J Am Geriatr Soc 55(6), 864-71.
- 28.U De Fanis, Wang G C, Fedarko N S. (2008) . T-lymphocytes expressing CC chemokine receptor-5 are increased in frail older adults.J Am Geriatr Soc 56(5), 904-8.
- 29.Walston J, Fedarko N, Yang H. (2008) The physical and biological characterization of a frail mouse model.J Gerontol A Biol Sci Med Sci. 63(4), 391-8.
- 30.Folsom A R, Boland L L, Cushman M. (2007) Frailty and risk of venous thromboembolism in older adults.J. , Gerontol A Biol Sci Med Sci 62(1), 79-82.
- 31.Margolick J B, Bream J H, Martínez-Maza O. (2017) Frailty and Circulating Markers of Inflammation. in HIV+ and HIV- Men in the Multicenter AIDS Cohort Study.J Aquir Immune Defic Syndr 74(4), 407-17.
- 32.Wada N I, Jacobson L P, Margolick J B. (2015) The effect of HAART-induced HIV suppression on circulating markers of inflammation and immune. 29(4), 463-71.
- 33.Erlandson K M, Allshouse A A, Jankowski C M. (2013) Association of functional impairment with inflammation and immune activation in HIV type 1-infected adults receiving effective antiretroviral therapy.J Infect Dis. 249-59.
- 34.Ding Y, Lin H, Liu X. (2017) Higher prevalence of frailty among a sample of HIV-infected middle-aged and older Chinese adults is associated with neurocognitive impairment and depressive symptoms.J Infect Dis. 215(5), 687-92.
- 35.Pathai S, Gilbert C, Weiss H A. (2013) Frailty in HIV-infected adults. in South Africa.J Acquir Immune Defic Syndr 62(1), 43-51.
- 36.Sheikh M S. (2018) Modified Kuppuswamy Scale updated for year 2018.Paripex Indian Jof Res.7(3). 217-218.