
A New Model of Body Composition: Concept and Design Features of the DBA-Model
Abstract
Indices, based on data such as height and weight in general and in particularly the body mass index (BMI), are often used to assess overweight. However, there is limited capacity to differentiate the amount of fat mass between individuals. This review refers to an anthropometric model called Dahlmann-Body-Analysis (DBA), which uses simple anthropometric parameters to define a Reference Weight (Ref-Wt). It is based on hand circumference as a proxy for the skeletal frame and, in addition, the circumference of the abdomen as a proxy for central obesity. Processed through a network of algorithms, the DBA model enabled to differentiate the Difference Weight – that means the difference between the Actual Weight and the Reference Weight – into fat mass and skeletal muscle mass.
The DBA-model resembles the 2-component model of Albert R. Behnke, which he considered as a living functional construct including essential fat. The DBA-model matches with Behnke`s 2-component model insofar, as the essential fat is replaced by a physiological amount of fat tissue. The review summarizes studies to compare DBA-derived data with Metropolitan Life Insurance tables, evaluates DBA-derived fat tissue mass with bioelectrical impedance analysis (BIA) derived results and analyses the meaning of the DBA model in clinical settings to uncover the underlying mechanisms of metabolic syndrome (MetS) pathogenesis with increasing amounts of fat mass. The model offers the opportunity to calculate changes in fat or muscle tissue in an absolute (kg) or relative (%) amount on individuals. The data suggest that the DBA-model has satisfactory prediction qualities for use as a practical tool in public health care.
Article Information
- Received
- Accepted
- Published
Academic Editor: Fatih Ozcelik, University of Health Sciences Turkey, Hamidiye Etfal Training and Education Hospital, Department of Biochemistry
Checked for plagiarism: Yes
Review by: Single-blind
Copyright © 2026 Nicolaus Dahlmann.
 This is an open-access article distributed under the terms of the Creative Commons Attribution License, which permits unrestricted use, distribution, and reproduction in any medium, provided the original author and source are credited.
Corresponding author: Nicolaus Dahlmann, Institute for Biometry and Nutrition, Hamburg, Germany, Institute for Clinical Biochemistry, University Hospital, Bonn, Germany —
Competing Interests
ND is the owner of the website www.dahlmann-body-analysis.de. For scientific work, the system is free of charge.
Funding
This research received no external funding.
Data Availability
No data-availability statement was provided by the authors.
Acknowledgements
The author is grateful to Dr. Vera Demond and Dr. Dietrich Klingmüller for assistance in anthropometric measurements and bioelectrical impedance analysis.
Citation:
Introduction
Due to their ease of computation and the availability of data on height and weight, indices of relative weight are often used to assess overweight. These measures, in particularly the body mass index (BMI), are used extensively in epidemiologic studies, where only weight and height data are available 1, 2.The rationale behind these studies is the assumption that in a normal unselected population the distribution of body weight at each level of height will reflect the distribution of obesity. But the BMI performance in severely overweight patients is impaired by the large amount of subcutaneous adipose tissue, which is an extraordinarily flexible and heterogeneous organ, characterized by its high degree of plasticity 3.
Based on a simple model to illustrate the variability of human tissues and in consequence the plasticity of body shape, we postulated in 1975 that the BMI – at that time named Quetelet-Index – has limited capacity to differentiate the amount of fat mass between individuals 4. In the meantime, this view became more and more accepted and resulted in a couple of indices, which have been developed beyond anthropometrics. However, newly developed indices should not be l`art pour l`art, but should accurately estimate body fat to have value for health risks associated with increased adiposity. In a review, 55 validated non-traditional obesity measures were identified. Of these, about 11 intend to measure the percentage of body fat (%FM), the rest are surrogate indices of overweight 5.
In 1920, J. Matiega communicated in Prague his body composition vision that it is the duty of anthropology to develop a method for testing human physical capacity and published a year later his seminal paper describing anthropometric measurement of skeletal muscle mass and three other functional body compartments. His system considered body weight as the sum of skeletal weight, skin plus subcutaneous adipose tissue weight, skeletal muscle weight and the remaining weight. For review see 6.
About 30 years later, Louis I. Dublin, a statistician and vice president of the Metropolitan Life Insurance (MLI) Company, was the first to lead the development of tables of normal weights, based on the average weights recorded for a given height. The need for an index of normal relative body weight was recognized soon after the actuaries noted the increased death claims of their overweight policyholders. However, as data accrued, he noted a rather wide range of weights for persons of the same sex and height, which he attributed to differences in body ‘shape’ or ‘frame’. To resolve the problem, he divided the distribution curve of weight at a given height into thirds, and labelled them ‘small’, ‘medium’ and ‘large’ frames. The average weights of those thirds were then labelled “ideal weights”, later more modestly termed “desirable weight”, for each of the three frame types 7, 8. But no instructions were given on how frame size should be determined on individuals.
Almost at the same time, Behnke presented in 1942 his pivotal studies on body composition as a two-component model, based on underwater weighing (UWW) 9. Similar as Matiega, he separated body mass into 2 components, the one he named “true body” including calcium salts as a 50%-part of bone weight, irreducible lipoid substances and other tissues embracing chiefly muscle, organs, brain, skin, and blood. This core body is surrounded by adipose tissue up to excess fat, which he identified to be the main factor affecting the specific gravity of a person. And he was aware that the percentage of skeletal weight in relation to the body as a whole, attributes to the fluctuation of specific gravity and awaits knowledge to which extend it will have an influence on the relative percentage variation of body weight 9.
Up to now, there is no agreement on any particular index which can distinguish between heaviness due to skeleton frame, muscularity or adiposity. The reason for that can be found at least in part in a lack of calibrating data, as A. Keys supposed 10. The plasticity of the human body with regard to surface and composition in connection with a lack of a standard model might be responsible for it. This background gave us motivation to look for a reference population, which was found in the “Schlegel” material 11.
Concept of the DBA model
The “Schlegel” material is based on measurements taken by W. Schlegel and his assistant G. Hopfeld on 1749 young adults aged from18 to 30 years for men and from 17 to 30 years for women, all living in Hamburg, Germany, and the surrounding area, being a random sample of the population (Table 1). The measurements of sex, age, height (Ht), weight (Wt) and hand circumference (HdC) were carried out between 1955 and 1973. Though the energy balance flipping point happened in the USA around the year 1960, it took another 20 years until the push phase of energy intake began 12. This shift accelerated in the 1980s, when a globalization of the corporate food industry took place and accelerated the displacement of long-established dietary patterns by ultra-processed foods (UPFs) as a key driver of the escalating global burden of multiple diet-related chronic diseases 13. Therefore, the study of Schlegel was performed at a time, when neither junk nor fast food and the corresponding restaurant chains existed in Germany.
Thus, the evaluated collective herewith fuses the two aspects of a low caloric lifestyle combined with the general fitness of young adults. Comparison of the “Schlegel” material with conscripts of the German Armed Forces and with school girls measured by the Hamburg Department of Health, respectively, is depicted in Table 1, indicating that the DBA model seems to reflect the body shape of the German population at that time 11.
Table 1. The basic characteristics of the “Schlegel” Material are given and compared with data of the German Armed Forces for men and with data of the Hamburg Department of Health for women.| Survey | Number | Age | Height | Weight | BMI | |
| (year) | (n) | (year) | (±SD) | (±SD) | (kg/m ² ) | |
| Men | ||||||
| "Schlegel" | 1964,0 | 1.111 | 24,4 | 175,7 (6,3) | 69,1 (7,3) | 22,4 |
| Conscripts* | 1964,0 | 231.810 | 19,0 | 175,1 (6,6) | 68,6 (9,3) | 22,4 |
| Women | ||||||
| "Schlegel" | 1967,1 | 638 | 22,4 | 164,5 (5,7) | 56,8 (6,3) | 20,7 |
| Young Women** | 1969,5 | 2.365 | 18,5 | 165,7 (5,8) | 56,9 (7,1) | 21,0 |
Skeletal Frame as a Crucial Part of Body Weight
The next step was the implementation of the hand circumference (HdC) as a proxy for skeleton frame. It gave for the first time the chance to develop weight-height-frame tables 11. A measure of frame allows the discrimination between those, who are heavy because of large fat free mass from those, whose overweight is largely fat and intends to give an answer to the afore mentioned question of Behnke. Adjusted for sex and height, a range of about 8.5 kg of bone weight can be expected for both genders that means a percentage variation of body weight of ±6% for men and ±7% for women, respectively, covering the ± 2s range of skeleton frame 14. The relationship between the Ref-Weight and the MLI-derived weight, both skeleton frame- adjusted, is shown in Figure 1a and Figure 1b.
Figure 1. Relationship between Ref-Weight vs. MLI-Weight, skeleton frame adjusted, for men (a) and women (b). Solid line, regression line, R²: coefficient of determination; r: Pearson`s correlation coefficient; SEE: standard error of estimate. 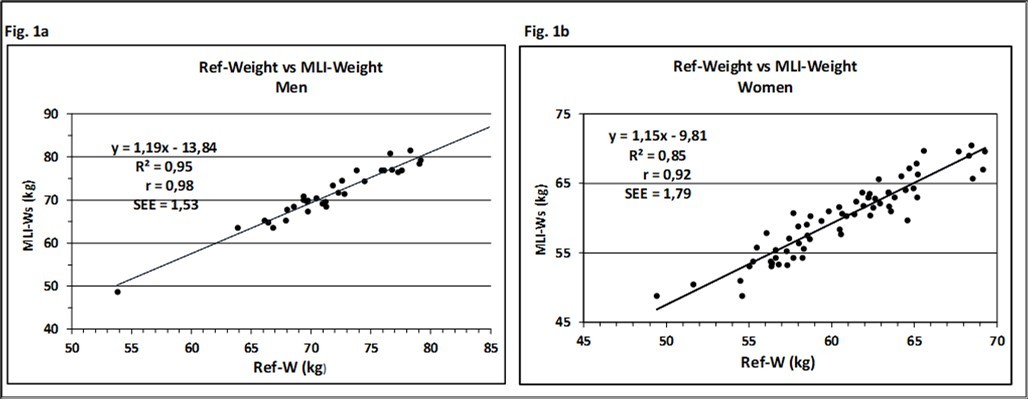
Download figure
To our knowledge, this is the only body composition system that takes the skeleton frame as a crucial part of body weight into account. The results underline the influence of the skeleton frame with regard to the final body weight and confirm the notice of L. Dublin that the wide range of weights for persons of the same sex and height is attributed to differences in body shape, at least for slim persons.
The Role of Adipose Tissue for the DBA model
When the candidates of the Refence Population were measured in the 1960s, there was no chance to determine body fat mass in a larger scale than laboratory yardstick, though of interest to make data comparable with today devices. Considering the characteristics of age and BMI for men (24.4 years, 22.4 kg/m²) and women (22.2 years, 20.9 kg/m²) the formulas of 15, 16, 17 to describe %FM could be addressed to the Refence Population, based on different techniques like air displacement plethysmography (ADP), specific weight determination (UWW) and the 4-compartment model (4c). At the end, a mean of 16.0 %FM for men and a mean of 25.5 %FM for women, respectively, are assigned to the DBA-model 18. Following the ideas of Matiega and Behnke of a two-component model of body composition, the concept of a core body was modified with the addition of a physiological amount of body fat having the potential to serve as a reference body, independent of age and race.
Up to that level, an increase in weight, however, could not be differentiated into fat or muscle mass. For that reason, the circumference of the abdomen (AC) as a marker for central obesity was integrated into the DBA model. Processed through a network of algorithms the DBA model enabled to differentiate the Difference Weight – that means the difference between the Actual Weight and the Reference Weight – into fat mass (ΔFM, kg) and skeletal muscle mass (ΔSMM, kg). The following diagram illustrates the conceptual design of the DBA model (Figure 2).
Figure 2. The diagram gives an overview of the concept of the DBA-model. Body weight is described as a 2-component model, based on a Reference Weight with a physiological amount of fat mass (16% for men and 25.5% for women). The difference to the Actual Weight is a surplus of fat tissue and musculature reflecting an individual life style. 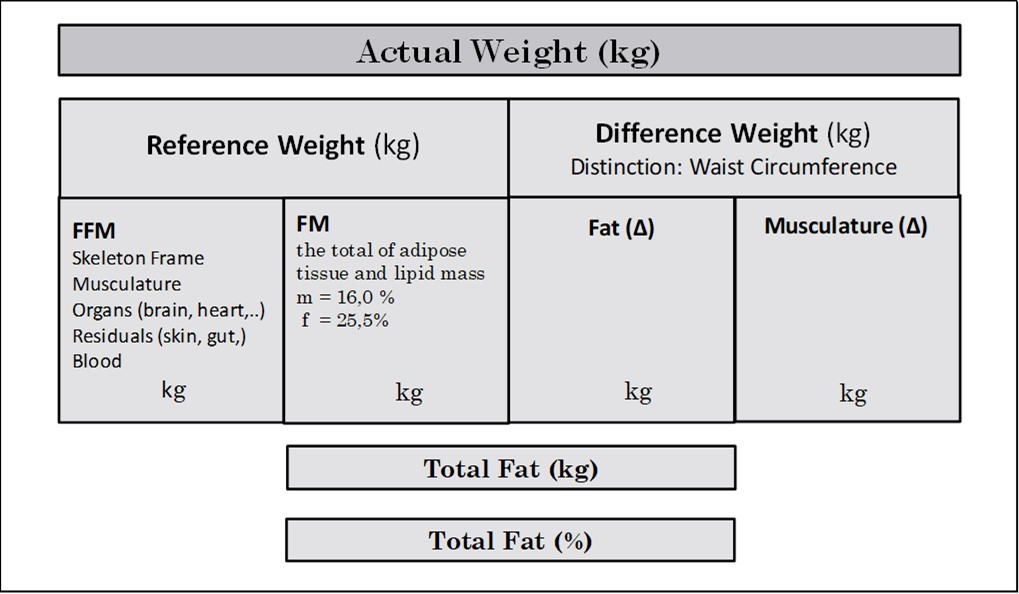
Download figure
Evaluation of Body Fat Measurements
To evaluate the evidence of this model, an entity of severely overweight white European persons was analysed with regard to their %FM processed by the DBA system. The results are compared to the %FM data produced on a bioelectrical impedance analysis (BIA) scale (Figure 3a and Figure 3b). From the entire sample, most of the patients were women (64%), the BMI ranged from 30 to 52 kg/m2, with 34% of patients having BMI > 40 kg/m2. Age spanned from 18 to 65 years.The mean estimates of %FM calculated by DBA- and the BIA-system were 36.7% vs. 36.1% for men and 49.1% vs. 49.7% for women, respectively and revealed no statistically significant differences (p > 0.05), demonstrating a high validity and precision between methods. The results underline that the model has potential to estimate accurately body fat 18, but data have to be confirmed by measurements of other technologies like dual-energy X-ray absorptiometry (DXA) and/or air displacement plethysmography (ADP).
Figure 3. Relationship between percent fat mass (%FM) derived by BIA- and DBA-method for men (a) and women (b). Solid line, regression line; R²: coefficient of determination; r: Pearson`s correlation coefficient; SEE: standard error of estimate. CCC: Lin`s concordance correlation coefficient.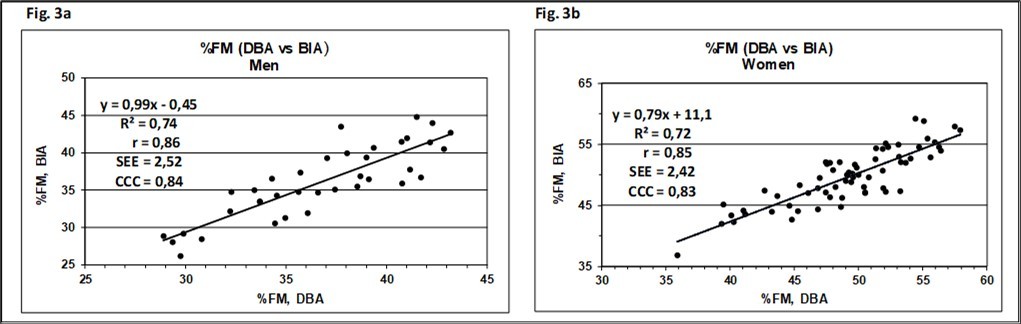
Download figure
The Link between Obesity and Muscle Mass
Obesity is associated with functional limitations in muscle performance. Skeletal muscle mass (SMM), a key component of adipose tissue-free body mass in humans, is central to the study of nutritional, physiologic, and metabolic processes. The true effect of obesity on skeletal muscle mass, including any interactions with aging effects, was analysed in a follow-up study 19. It investigated the impact of obesity on the stimulation of muscle growth, based on the same dataset as described before. The increase of skeletal muscle mass (ΔSMM, kg) compared to the individual reference weight was calculated and adjusted to height (ΔSMMI, kg/m²). The increase in the association between Actual Weight, and ΔSMMI with BMI is demonstrated for men (Figure 4a-b) and women (Figure 4c-d). The mean values of ΔSMM as an estimate of muscle mass gain calculated by the DBA-system were 11.8 kg for men and 8.9 kg for women, respectively. The data followed a linear, significantly rising relationship with BMI (ß > 0, p<0.001). The result underlines that the relationship between BMI and SMM becomes more specific, when body weight is virtually stripped of fat mass and organs and normalized for height squared.
Muscle mass data estimated by the DBA model are compared with 15 DXA-derived predictive equations. Simple, valid, reliable and inexpensive methods measuring SMM are important for research and clinical practice. A couple of dual-energy X-ray absorptiometry (DXA)-derived formulas based on sex, age, height, weight, and waist circumference are described 20. DXA-systems provide a measure of appendicular lean soft tissue (ALST), a fat- and bone mineral-free component that includes muscle and other components. ALST is usually used as a good surrogate for SMM.
Figure 4. Association of anthropometric variables with BMI for men (a-b) and women (c-d). Solid line, regression line; R²: coefficient of determination.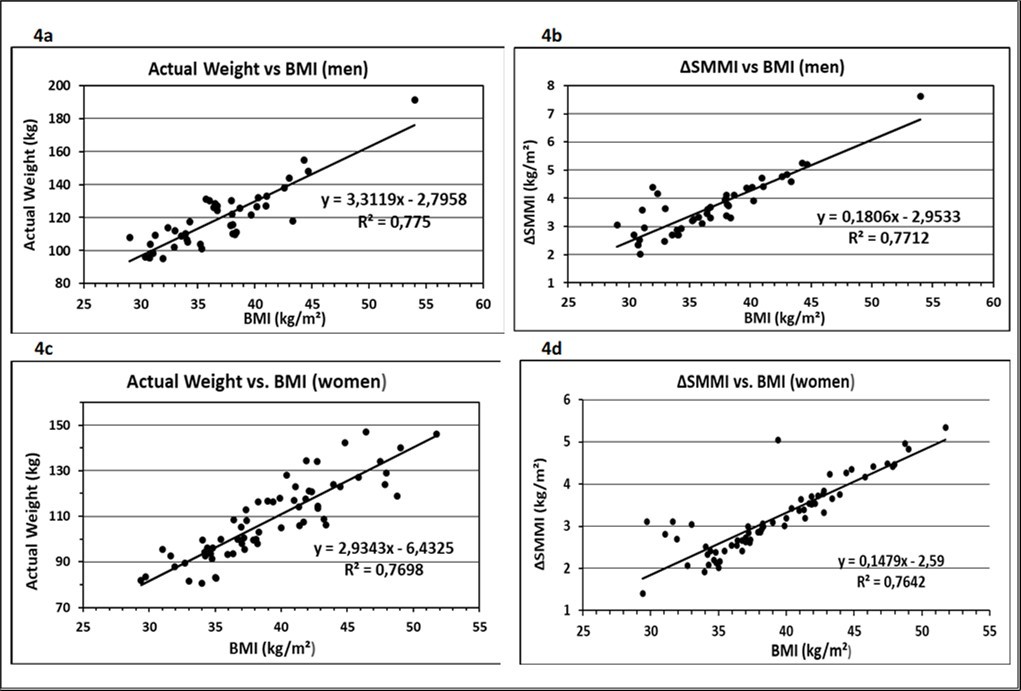
Download figure
Appendicular skeletal muscle mass (ASM) measured by DXA is a relevant indicator of body muscle mass, and is widely used in the diagnosis of sarcopenia 21. However, CT, MRI and DXA are impractical for large epidemiological studies because of their high cost, radiation exposure and lack of access to technical equipment. Simple, valid, reliable and inexpensive methods for measuring skeletal muscle mass are still needed. A practical alternative for estimating muscle mass could be anthropometry.
Algorithms derived from reference methods to predict certain risks often include an age correction term, starting at the age of 18. It is generally assumed that muscle mass dwindles with age. In a review by Abdalla et al. 20 of DXA-derived formulas for predicting skeletal muscle mass, out of 34 studies in adults aged 18 – 85 years 9 (26.5%) lead to an age term with a negative sign. The fact that the resulting muscle atrophy does not necessarily correspond to reality is demonstrated by the data of the study population that did not show a decrease in muscle mass with age in either men or women up to an age of 65 years (Figure 5a-b) 19.
Figure 5. Relation between age and the increase of muscle mass, height adjusted, in men (a) and women (b). The slope of the regression lines was not significantly different from zero (ß = 0, p>0.05). 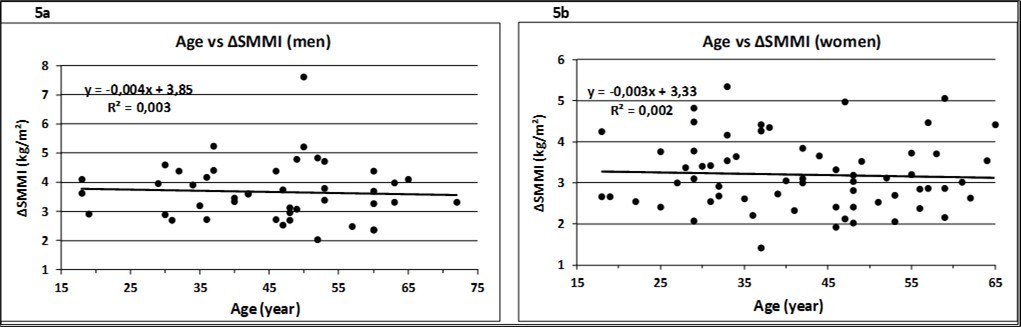
Download figure
Monitoring changes in muscle mass and in addition fat mass will rise strong significance following glucagon like peptide-1 receptor agonist (GLP-1 RAs) therapies that have demonstrated substantial weight loss effects among patients with diabetes and obesity. But there is concern about the total change in body composition that includes a significant decrease in both FFM and FM, meaning that there is evidence that weight loss reveals a concomitant loss in muscle mass. However, a key challenge of GLP-1 therapy is that adherence is often low. The consequence is a weight swing, as cessation of GLP-1 treatment is associated with marked weight regain, notably fat tissue, and may exceed lean mass recovery gains. Specifically, significant muscle losses during treatment, coupled with disproportionate fat regain post-cessation therapy, may accelerate sarcopenic obesity. This highlights the need for further longitudinal research including imaging techniques like MRI or CT. Still, a low-cost system would be of advantage. For review see 22.
The Meaning of the DBA model in Clinical Settings
As mentioned before, the development of non-traditional obesity measures should not end in itself, but should account for health risks associated with increased adiposity, as the review points out. Nevertheless, most of the non-traditional measures did not directly measure total body fat and did not involve health assessments 5. To evaluate the meaning of the DBA model in clinical settings, we launched a study to uncover the underlying mechanisms of MetS pathogenesis with increasing amounts of fat mass. The study was based on the same data set as mentioned before. %FM data were statistically compared with systolic blood pressure (SBP) and the MetS risk factors triglyceride (TG), HDL cholesterol (HDL-C), fasting plasma glucose (FPG) and, in addition, the parameters C-reactive protein (CRP) and low-density lipoprotein (LDL-C) using receiver operating curves (ROC) based on sensitivity and specificity, area under curve (AUC), correlation coefficients and regression analysis 23.
Figure 6. Association of metabolic risk factors with %FM detected by the DBA-model. Insulin (a), HOMA-IR (b), HDL-C (c) and CRP (d) correlated positively with %FM-DBA. Trend lines were calculated as linear regressions. ß > 0, slope is significant to zero. 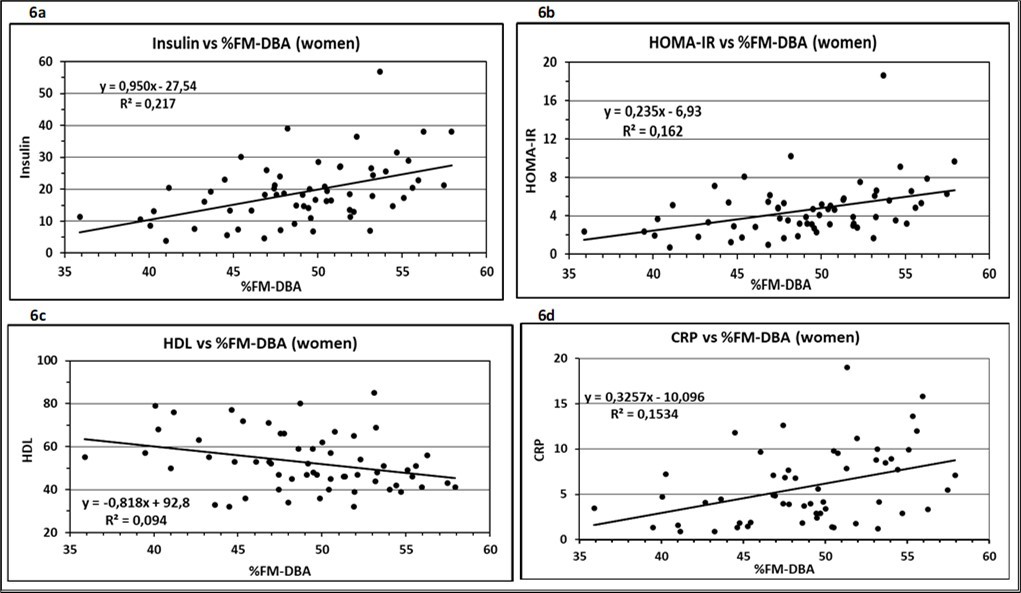
Download figure
Associations between body fat mass measured by the DBA system and the systolic blood pressure and seven metabolic risk factors showed a significantly rising linear relationship for the parameters Insulin, HOMA-IR, HDL-C and CRP (Figure 6 a-d). Insulin was measured as part of the HOMA index. CRP was included to the investigation as recent studies have shown that CRP is elevated in subjects with MetS and predicts the development of MetS 24. LDL-C is part of the study as the primary driver of atherogenesis and the endpoint of MetS development leading to a transformation of macrophages to an inflammatory phenotype 25. In contrast to these results, the variables Glucose, TG, LDL-C and SBP had no significant association to the increasing amount of body fat, indicating that the atherosclerotic process is not yet as severe to result in an elevated blood pressure. Taken together, the data enrol the picture of a group that is, despite the seriousness of obesity, still in the state of a prediabetes.
Further studies, however, must give evidence to which extend the DBA model has the potential to identify patients at risk for chronic diseases like CVD based on traits of interest like Sirtuin 1.
Summary and Perspective
Coming back to the 2-component model of Albert R. Behnke, he adhered to the view that the ”true body” is a living functional construct including essential fat, which he labelled “lean body mass” (LBM). This term should not be mixed up with the term “fat free mass” (FFM), which is derived experimentally by UWW as the difference between body weight and body fat embracing nonpolar lipids (mainly TG and cholesterol esters) and polar lipids (phospholipids, sphingolipids, and glycolipids). They are structural components of cell membrane and neural tissues and meet Behnke´s “essential” fat. The DBA-model matches with Behnke`s 2-component model insofar, as the essential fat is replaced by a physiological amount of fat tissue. Behnke´s “true body” becomes consequently the “reference body”, which serves as an internal standard for the analysis of body composition. From the very beginning, we were convinced that the plasticity of the human body cannot be described by a single formula and shared the opinion of Piers et al. that no formula relating weight to height can measure adiposity on an individual level 26.
The model offers the opportunity to calculate changes in fat or muscle tissue in an absolute (kg) or relative (%) amount on individuals. The data suggest that the DBA-model has satisfactory prediction qualities for use as a practical tool in public health care. The system is available to anyone at any point of the world and fulfills the expectations of Margret Ashwell that all you need to identify people at early health risk is a scale and a string 27.
Declarations
Consent for publication
Not applicable.
References
- 1.Collaboration Global BMI Mortality, E Di Angelantonio, Bhupathiraju S. (2016) Body-mass index and all-cause mortality: individual-participant-data meta-analysis of 239 prospective studies in four continents.Lancet Lond Engl. 388(10046), 776-786.
- 2.A Berrington de Gonzalez, Hartge P, Cerhan J R. (2010) Body-mass index and mortality among 1.46 million white adults.N. , Engl J Med 363(23), 2211-2219.
- 3.Sakers A, De Siqueira MK, Seale P, Villanueva C J. (2022) . Adipose-tissue plasticity in health and disease.Cell 185(3), 419-446.
- 4.Dahlmann N. (1975) Infant development and adipositas (author’s transl)].Z Kinderheilkd. 119(3), 181-195.
- 5.Palumbo A M, Jacob C M, Khademioore S. (2025) Validity of non-traditional measures of obesity compared to total body fat across the life course: A systematic review and meta-analysis.ObesRev. , Off J Int Assoc StudyObes 26(6), 10-1111.
- 6.Heymsfield S B, Adamek M, Gonzalez M C, Jia G, Thomas D M. (2014) Assessing skeletal muscle mass: historical overview and state of the art.J Cachexia Sarcopenia Muscle. 5(1), 9-18.
- 7.Eknoyan G. (2008) Adolphe Quetelet (1796-1874) -the average man and indices of obesity.Nephrol. , Dial Transplant OffPublEurDialTransplAssoc -EurRen Assoc 23(1), 47-51.
- 8.Kemsley W F, Billewicz W Z, Thomson A M. (1962) A new weight-for-height standard based on British anthropometric data.Br. , J Prev Soc Med 16, 189-195.
- 9.Behnke A R, Feen B G, Welham W C. (1995) The specific gravity of healthy men. Body weight divided by volume as an index of obesity. 3(3), 295-300.
- 10.Keys A, Fidanza F, Karvonen M J, Kimura N, Taylor H L. (1972) . Indices of relative weight and obesity.J Chronic Dis 25, 329-343.
- 11.Dahlmann N, Schlegel W, Hölzer K H, Hopfeld G. (1977) A simple method of determining the ideal weight.ZMorpholAnthropol.
- 12.Swinburn B A, Sacks G, Hall K D. (2011) The global obesity pandemic: shaped by global drivers and local environments.The Lancet. 378(9793), 804-814.
- 13.Monteiro C A, Louzada M L, Steele-Martinez E. (2025) Ultra-processed foods and human health: the main thesis and the evidence.The Lancet. 406(10520), 2667-2684.
- 14.Dahlmann N, Klingmüller D. (2023) The Skeleton Frame as a Crucial Part of Body Weight:. , Comparison to Metropolitan Life Insurance Data.Int J Sci Res IJSR 12(2), 369-376.
- 15.Deurenberg P, Yap M, van Staveren WA. (1998) Body mass index and percent body fat: a meta analysis among different ethnic groups.Int JObes. 22, 1164-1171.
- 16.Gallagher D, Heymsfield S B, Heo M, Jebb S A, Murgatroyd P R et al. (2000) Healthy percentage body fat ranges: an approach for developing guidelines based on body mass index.AmJ Clin Nutr. 72(3), 694-701.
- 17.Müller M J, Braun W, Enderle J, Bosy-Westphal A. (2016) Beyond BMI: Conceptual Issues Related to Overweight and Obese Patients.ObesFacts. 9(3), 193-205.
- 18.Dahlmann N, Demond V. (2022) A new anthropometric model for body composition estimation: Comparison with a bioelectrical impedance consumer device.PLOS ONE. 17(9), 10-1371.
- 19.Dahlmann N, Klingmüller D. (2025) A New Model of Body Composition Detects Association Between Severe Obesity and Increase in Skeletal Muscle Mass.J Model Based Res. 2(2), 10-14302.
- 20.Abdalla P P, da Silva LSL, ACR Venturini. (2023) Anthropometric equations to estimate appendicular muscle mass from dual-energy X-ray absorptiometry (DXA): A scoping review.Arch Gerontol Geriatr. 110, 104972-10.
- 21.Baumgartner R N, Koehler K M, Gallagher D. (1998) Epidemiology of sarcopenia among the elderly in. , New Mexico.AmJ Epidemiol 147(8), 755-763.
- 22.Prokopidis K, Daly R M, Suetta C. (2025) Weighing the risk of GLP-1 treatment in older adults: Should we be concerned about sarcopenic obesity?JNutrHealth Aging. 29(10), 100652-10.
- 23.Dahlmann N, Klingmüller D. (2023) A New Anthropometric Model for Body Composition Estimation in the Assessment of Metabolic Risk Factors of Obese Women.Arch Intern Med Res. 06(02), 10-26502.
- 24.Nakamura H, Ito H, Egami Y. (2008) Waist circumference is the main determinant of elevated C-reactive protein in metabolic syndrome.Diabetes Res ClinPract. 79(2), 330-336.
- 25.Borén J, Chapman M J, Krauss R M. (2020) Low-density lipoproteins cause atherosclerotic cardiovascular disease: pathophysiological, genetic, and therapeutic insights: a consensus statement from the European Atherosclerosis Society Consensus Panel.EurHeart. , J 41(24), 2313-2330.