
Seasonal ARIMA model for Covid-19 pandemic Prediction in the United States
Abstract
The COVID-19 pandemic has had a profound impact on global health and economies. The pandemic continues to spread and accurate forecasting of its spread is essential for the effective management of healthcare systems and the development of effective policies. The development of forecasting models for COVID-19 has become increasingly important as the pandemic continues to evolve. In this paper, we will summarize the Covid-19 pandemic in the United States state by state. And then, we utilize the temporal data of coronavirus spread from January 18, 2020 to January 29, 2023. Finally, we model the evolution of the COVID-19 outbreak and perform prediction using ARIMA and time series forecasting models on some selected states.
Article Information
- Received
- Accepted
- Published
Academic Editor: Raul Isea, Fundación Instituto de Estudios Avanzados -IDEA
Checked for plagiarism: Yes
Review by: Single-blind
Copyright © 2023 Lei Wang
 This is an open-access article distributed under the terms of the Creative Commons Attribution License, which permits unrestricted use, distribution, and reproduction in any medium, provided the original author and source are credited.
Corresponding author: Lei Wang, College of Science and Mathematics, Augusta University —
Competing Interests
The authors have declared that no competing interests exist.
Funding
No specific funding statement was provided by the authors.
Data Availability
No data-availability statement was provided by the authors.
Acknowledgements
The author would like to thank some comments and constructive suggestions from Dr.Olusegun Michael Otunuga from the college of Science and Math and Dr.Hinton Romana from writing center in Augusta University. Several stimulating discussions and comments allowed me to develop original ideas and improve my paper.
Citation:
Introduction
In the United States, annual community outbreaks of coronavirus infections typically occur during late fall and winter. There may be variation in the timing of outbreaks between regions and between communities in the same region.
In the early months of the pandemic, cases and deaths were heavily concentrated in the metropoli- tan areas of New York, New Orleans, Boston and Detroit with other major cities. Overall, urban areas with more ethically and racially diverse population were initially impacted more than areas less diverse.
There are various approaches to forecasting the spread of COVID-19, including statistical mod- els, machine learning models, and hybrid models. Statistical models are based on mathematical and statistical models and include regression analysis, time series analysis, and ARIMA models. Machine learning models, such as neural networks and support vector machines, are based on patterns in the data and use algorithms to make predictions. Hybrid models combine elements of statistical and machine learning models and can be more accurate than either approach alone 9.
In recent years, there has been a growing interest in using deep learning techniques for COVID-19 forecasting. Deep learning is a type of machine learning that uses artificial neural networks with multiple layers to model complex patterns in data. One example of a deep learning model is the Long Short-Term Memory (LSTM) network, which has been used to make predictions about the spread of COVID-19.
Another recent development is the use of ensemble models, which combine the predictions of multiple models to make a final prediction. Ensemble models can be more accurate than individual models because they are able to capture the strengths of different models and account for uncertainty in the data.
Methods
Over the last 35 years there has been considerable information accumulated about forecasting techniques and how these methods are applied in a wide variety of settings. Conflicting results are very common when performing advanced forecasting competitions between different methods. As forecasting tasks can vary by many dimensions, it is unlikely that one method will be better than all others for all forecasting scenarios. What we require from a forecasting method are consistently sensible forecasts, and these should be frequently evaluated against the task at hand.
Despite the progress made in the development of COVID-19 forecasting models, there are still many challenges to overcome. One major challenge is the limited availability of high-quality data, which can lead to inaccurate predictions. In addition, the rapid evolution of the pandemic makes it difficult to develop models that are both accurate and relevant over time 2.
Another challenge is the difficulty in accounting for external factors, such as government policies and social behavior that can have a significant impact on the spread of COVID-19. For example, a sudden increase in testing can result in a spike in the number of confirmed cases, which can make it difficult to accurately predict the future spread of the disease.
A Short Review of Covid-19 situations
The COVID-19 pandemic has had a profound impact on the United States with different states experiencing different levels of impact. The impact of the pandemic on each state has been influenced by factors such as population density, demographics, lockdown policy and local response measures.
Northeast Region
States in the Northeast region of the U.S., such as New York, New Jersey, and Massachusetts, were among the hardest hit by the pandemic in the early stages of the outbreak. These states have large urban areas with high population densities, which facilitated the spread of the virus. As a result, these states have some of the highest numbers of confirmed cases and deaths in the country.
Midwest Region
States in the Midwest region, such as Illinois, Michigan, and Ohio, have also been significantly impacted by the pandemic. These states had different experiences with pandemic. For exam- ple, some rural communities have led to a wide range of experiences with the pandemic. But some rural communities in these states have been relatively spared from the pandemic, while larger urban areas have seen a more significant impact.
South Region
States in the South region, such as Florida, Texas, and Georgia, have also been impacted by the pandemic although the impact has varied widely across the region. Some states in the South, such as Florida and Texas have experienced a large number of confirmed cases and deaths, while others, such as Georgia, have experienced a more moderate impact.
West Region
The situation with the COVID-19 pandemic in the western region of the United States varied by state but overall was serious. Some of the worst-affected states in the West at that time were California, Oregon, Arizona, and Washington. Many states implemented measures to slow the spread of the virus. As of knowledge cutoff in 2021, vaccines were being distributed in the US, which offered hope for controlling the spread of the virus in the future.
Data Collection
The data for the ongoing Covid-19 outbreak in the United States is collected from the Center for Disease Control and Prevention. The columns of this dataset include the Total number of weekly cases, Weekly Death and Weekly tests volume of Covid-19 patients accumulating in all the states, on a weekly basis from January 29, 2020 to January 18, 2023. The total cases per 100,000, allow for comparisons between areas with different population sizes.
In this paper, we collected weekly cases and weekly deaths from five states, New York, California, Texas, New Jersy, Florida in the United States. Then we made the comparison and do the simulation analysis for better forecasting models 1.
Forecasting Accuracy
We will use different criteria to evaluate the performance of different forecasting models. In order to measure forecasting accuracy, a number of metrics can be used, including mean absolute error (MAE), root mean squared error (RMSE), mean absolute percentage error (MAPE), mean percentage error (MPE) and the mean absolute scaled error (MASE). Comparison between different forecasting models is based on these criteria and formulas 3.
Pt is the predicted value at time t, Zt is the observed value at time t and N is the number of predictions.

However, it is important to note that forecasting accuracy can be influenced by a range of factors, including the quality and quantity of available data, the choice of forecasting method, and the inherent unpredictability of some phenomena. As a result, it is often difficult to achieve high levels of forecasting accuracy in practice, and forecasters must continually refine their methods and adjust their expectations based on new data and insights.
ARIMA and DHR models
Introduction of ARIMA model
The time series processes we have discussed so far are all stationary processes, but many applied time series, particularly those arising from economic and business areas, are non-stationary. With respect to the class of covariance stationary processes, non-stationary time series can occur in many different ways. They could have non-constant means µt, time-varying second moments such as non- constant variance σ2, or both of these properties. In this section, we will explain the construction of a very useful class of homogeneous non-stationary time series models, the autoregressive integrated moving average models. Some useful differencing and variance stabilizing transformations are introduced to connect the stationary and non-stationary time series models 7.
Many models used in practice are of the simple ARIMA type, which have a long history and were formalized in Box and Jenkins. ARIMA stands for Autoregressive Integrated Moving Average and an ARIMA (p; d; q) model for an observed series series {yt}, t= 1 · · · Tis a model where the dthdifference zt= yt− yt−dis taken to induce stationarity of the series. The process {zt} is then modeled as zt= µ+ ϵtwith

where ut is white noise and usually Normally distributed as ut~ N (0; σ2). The stationarity and invertibility conditions are simply that the roots of ϕ(L) and η(L), respectively, are outside the unit circle 5. An accessible and extensive treatment of the use of Bayesian methods for ARIMA models can be found in Bauwens et al. (1999).
Since we are also taking into account the seasonal pattern even if it is weak, we should also examine the seasonal ARIMA process. This model is built by adding seasonal terms in the non- seasonal ARIMA model we mentioned before. One shorthand notation for the model is{(p, d, q)} : non-seasonal part

{(P, D, Q)m}: seasonal part.
P = seasonal AR order, D = seasonal differencing, Q = seasonal MA order
m: the number of observations before the next year starts; seasonal period.
The seasonal parts have term non-seasonal components with backshifts of the seasonal period. For instance, we take { ARIMA(p, d, q)(P, D, Q)m} model for weekly data (m=52). Without differencing operations, this process can be formally written as:

A seasonal ARIMA model incorporates both non-seasonal and seasonal factors in a multiplicative fashion.
Dynamic Harmonic Regression with ARIMA error
Dynamic Harmonic Regression (DHR) is a statistical modeling technique used for time series data analysis. It is a type of regression model that accounts for the seasonality and non-stationarity of the data. The model combines the strengths of regression analysis and time series decomposition, making it a useful tool for predicting future values based on historical trends
Firstly, we considered regression models

The system was composed by four components: trend (T), sustained cyclical (C) with period different to the seasonality, seasonal (S) and white noise (ϵt).
The measured values of y are the output (observations) series of a system of stochastic state space equations, which can then be broken down to allow for estimation of the four components.
So for such time series, we prefer a harmonic regression approach where the seasonal pattern is modelled using Fourier terms with short-term time series dynamics handled by an ARIMA error. The DHR model consists of two parts: a regression component and a harmonic component. The regression component models the underlying linear relationship between the independent variables and the dependent variables, while the harmonic component models the seasonal patterns in the data. The harmonic component uses trigonometric functions, such as sine and cosine, to capture the patterns in the data 7.

where m is the seasonal period, αj and βj are regression coefficients, and ϵt is modeled as a non- seasonal ARIMA process.
One of the advantages of the DHR model is that it can handle non-stationary time series data, which is common in many real-world applications. The model can account for changes in the mean and variance of the data over time, making it a useful tool for analyzing data with trends and seasonality.
Another advantage of the DHR model is its ability to handle multi-seasonal patterns in the data. For example, the model can handle monthly, quarterly, and yearly patterns in the data. This makes the DHR model a useful tool for analyzing complex time series data with multiple seasonal patterns 4.
Main Results
I selected the best model by minimizing the forecasting criteria. A variety of forecasting methods often apply to any particular risk scenario. Researchers and government use multiple forecasting methods that can perform well at different phases of pandemic and take consideration in chose to best exploit the available historical data and degree of market knowledge. The key is to pick the most effective and flexible forecasting models, blend their best features, and shift between them as needed to keep forecast accuracy at its peak. This research paper delves into the details of ten forecasting methods, including why, when, and how they should be used to realize the greatest overall improvements in forecast accuracy.
Since the start of the pandemic, 1,106,824 people in the U.S. have died from COVID-19. In the last week, Florida reported the highest number of new deaths with 444, followed by California with 273.
As of February 4, 2023, the Center for Disease Control and Prevention (CDC) reports 102,447,438 cases of COVID-19 in the United States.
California has over 11 million cases, followed by Texas with over 8 million, and Florida with over 7 million.
| Forecasting weekly cases results | ||||||
| Models | RMSE | MAE | MPE | MAAPE | MASE | |
| CA | DHR | 0.286885 | 0.20837 | −Inf | Inf | 0.22897 |
| ARIMA(2, 1, 3)(0, 1, 1)(52) | 0.29194 | 0.179239 | −0.0357796 | 3.05504 | 0.19697 | |
| Taxes | DHR | 0.25773 | 0.19498 | 0.17058 | 3.6576 | 0.1609 |
| ARIMA(1, 1, 2)(0, 1, 1)(52) | 0.28103 | 0.169164 | −0.29621 | 3.1259 | 0.13962 | |
| NYC | DHR | 0.49885 | 0.330884 | −Inf | Inf | 0.326175 |
| ARIMA(1, 1, 2)(1, 1, 1) (52) | 0.58931 | 0.31319 | −0.81929 | 6.97477 | 0.30874 | |
| NJ | DHR | 0.4103 | 0.29194 | −Inf | Inf | 0.25853 |
| ARIMA(1, 1, 1)(0, 1, 1)(52) | 0.4723 | 0.27888 | 0.436753 | 6.3331 | 0.24697 | |
| Florida | DHR | 0.36644 | 0.26314 | 0.49788 | 4.9343 | 0.29491 |
| ARIMA(0, 1, 1)(0, 1, 1)(52) | 0.40849 | 0.23651 | 0.99494 | 4.1269 | 0.2651 | |
At a per capital level, the daily average of new cases in the last week was highest in New Jersey and Alabama.
As the figure 1 shows that the weekly deaths in California shows continuous decrease from March 2023 to June 2023. However, the weekly cases didn’t change a lot. As the figure 2 shows that weekly deaths in New York shows a short increase and then decreased until the end of 2023. The weekly cases are controlled at the a stable level.
For the most of the state data, DHR has better performed compared to ARIMA on scale of MAE, RMSE, RRSE, and MAPE error matrices. The New York State and California are typical metropolitan around the world. The trend analysis shows rapid growth in the deaths, and prediction study shows stable rise in the weekly cases.
Figure 1. Forecasting results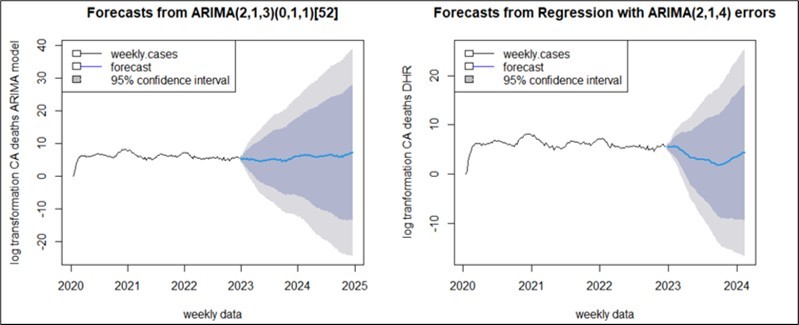
Download figure
Figure 2. Forecasting results
Download figure
| Forecasting weekly cases results | ||||||
| Models | RMSE | MAE | MPE | MAAPE | MASE | |
| CA | DHR | 0.2695 | 0.1861 | 0.63697 | 2.18811 | 0.1242 |
| ARIMA(1, 1, 2)(1, 0, 0) (52) | 0.29994 | 0.1975 | 0.48856 | 2.3396 | 0.7412 | |
| Taxes | DHR | 0.26953 | 0.200197 | 0.1451 | 2.02599 | 0.18924 |
| ARIMA(1, 1, 5)(0, 1, 1) (52) | 0.21765 | 0.13684 | −0.12463 | 1.31365 | 0.12935 | |
| NYC | DHR | 0.23193 | 0.16612 | 0.15716 | 1.7781 | 0.15095 |
| ARIMA(0, 1, 1)(0, 1, 1) (52) | 0.26776 | 0.18094 | −0.0634 | 1.93283 | 0.16442 | |
| NJ | DHR | 0.2471 | 0.1766 | 0.1041 | 1.94698 | 0.16569 |
| ARIMA(3, 1, 2)(1, 0, 1) (52) | 0.26632 | 0.18188 | 0.0566 | 2.0264 | 0.17069 | |
| Florida | DHR | 0.27682 | 0.18616 | 0.39809 | 1.9999 | 0.13689 |
| ARIMA(2, 1, 1)(1, 0, 1) (52) | 0.310635 | 0.20267 | 0.18793 | 2.21125 | 0.7303 | |
New York and California were two of the states hardest hit by the COVID-19 pandemic in the United States. In early 2020, New York became the epicenter of the outbreak in the US, with a significant number of cases and deaths. The state implemented strict measures to try to control the spread of the virus, including lockdowns and mandatory mask-wearing, which helped to bring the situation under control. As of early 2023, the state has administered millions of vaccine doses, and the number of new cases and deaths has declined significantly.
Similarly, California also experienced a surge in cases and deaths in the early stages of the pan- demic, prompting the state to implement a series of measures to control the spread, including stay- at-home orders and mask mandates. As of early 2023, California has also administered millions of vaccine doses, and the number of new cases and deaths has declined significantly. However, like many other parts of the world, both states have had to navigate the ongoing challenges posed by the COVID-19 pandemic, including new variants of the virus and the need for continued vigilance and public health measures 3.In conclusion, COVID-19 forecasting models play a critical role in managing the spread of the pandemic. Despite the challenges, recent advances in machine learning and deep learning techniques offer promising avenues for improving the accuracy of COVID-19 forecasting models. Further re- search is needed to address the limitations of current approaches and to develop models that are
better able to account for the dynamic and evolving nature of the pandemic 1.
The objective in providing crucial statistical techniques is to enable government and public to make informed decisions regarding Covid-19 pandemic. Eventually, the summary of various exist- ing forecasting models can provide information to develop an appropriate forecasting model which describes the inherent feature of the series.
References
- 1.Naresh K, Seba S. (2020) COVID-19 Pandemic Prediction using Time Series Forecasting Models. The 11th ICCCNT 2020 conference .
- 2.Saud S, Jaini G, Aishita J, Sunny A, Sagar J et al. (2021) Analysis and Prediction of COVID-19 using Regression Models and Time Series Forecasting. 11th International Conference on Cloud Computing, Data Science & Engineering .
- 3.Fotios P, Spyros M. (2020) Forecasting the novel coronavirus COVID-19. Plos One 15(3): e0231236.https://doi.org/10.1371/journal.pone.0231236.
- 4.R J Hyndman, Athanasopoulos G. (2014) Forecasting: Principles and Practice, OTexts, 2nd edition. , ISBN 978-0.
- 5.RATNADIP A. (2013) An Introductory Study on Time Series Modeling and Forecasting , LAP Lambert Academic Pub- lishing. , ISBN 10, 3659335088.
- 6.Box G, Jenkins G. (1970) Time Series Analysis: Forecasting and Control, Holden-Day. , San Francisco
- 7.P J Brockwell, R A Davis. (2002) Introduction to Time Series and Forecasting, Second Edition. , New York
- 8.A M David, Wlodzimierz T. (2019) Dynamic harmonic regression and irregular sampling; avoiding pre-processing and minimising modelling assumptions Environmental Modelling. , Software 121, 104503.